
How to Use Data from Microsoft Dynamics 365 Business Central In Excel Using OData Feeds
Connecting to Excel with OData fields can be very powerful, not only for Power BI, but also for Microsoft Dynamics 365 Business Central. By simply connecting to a Business Central page as an OData feed, you can pull data into Excel to create pivot tables and more, opening the door to many benefits. In this How-To blog post, we demonstrate how to use Business Central OData feeds with Excel.
Microsoft Dynamics Business Central comes with OData feeds for account schedules out of the box. There are many uses for all levels of Excel users. In all the following examples, data flows only one way—from Business Central to Excel, and only the data that is on the BC page you’re working with is pulled into Excel.
The Basics: Creating Simple Reports with Business Central OData Feeds
For simple yet valuable reports, it’s easy to use an OData feed. For example, you can create an OData feed to pull item ledger entries into Excel, which gives you an Excel-formatted table from which you can create a pivot table and easily get a quick report on your inventory movement for specified periods of time. Because it has all the properties of the page, it can calculate costs, quantities, and so on. This is an example of a very easy, quick way to get an updateable report out of BC in Excel.
Stepping It Up: Connecting Multiple Queries with Business Central OData Feeds and Power Query
You can also create OData feeds for more sophisticated uses like creating two or more queries and joining them together through a relationship. For example, if you want to report on the sales and cost of goods by customer for a particular item, you create an OData feed to pull the customer, item, and even the invoice information from the Value Entry and Customer tables. From there, you can create a pivot table using Power Query.
Digging In: Using Power Pivot for Snowflaking
Finally, for more advanced reports, you can use Power Pivot to pull in the data from multiple tables to include not only base fields, but also calculated columns. From there, you normalize that data and create a Pivot table, which gives you a three-dimensional view of that data. This is commonly known as “snowflaking.” A snowflake schema is an arrangement of tables where the relationship has the shape of a snowflake. Snowflaking is a method of normalizing where centralized fact tables are connected to multiple dimension tables with the fact table in the middle. So, for example, you could use this method with data from the Calendar, Customer, and Item tables to report on which items customers have sold by month.
In short, the ability to use OData feeds with Business Central and Excel is a surprisingly easy way to take advantage of the benefits of Excel using data from your ERP system.
Tutorial: Creating a Pivot Table in Excel Using Business Central OData Feeds
In the following example, we demonstrate how to quickly create a simple pivot table in Excel using Business Central OData feeds.
Step 1: Connect to Business Central OData Feeds and Load the Data Into Excel
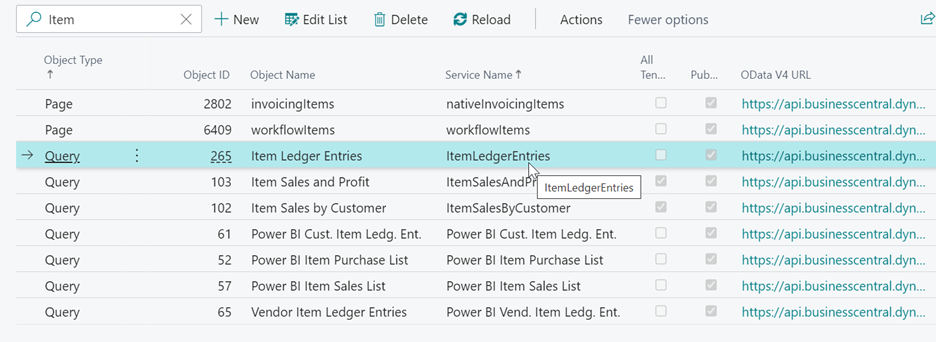
- In Business Central, type “Web Services” in the Search (magnifying glass) field in the top right of the ribbon.
- On the Web Services page, select the one you want and copy the OData V4 URL. In this example, we connect to the Item Ledger Entries.
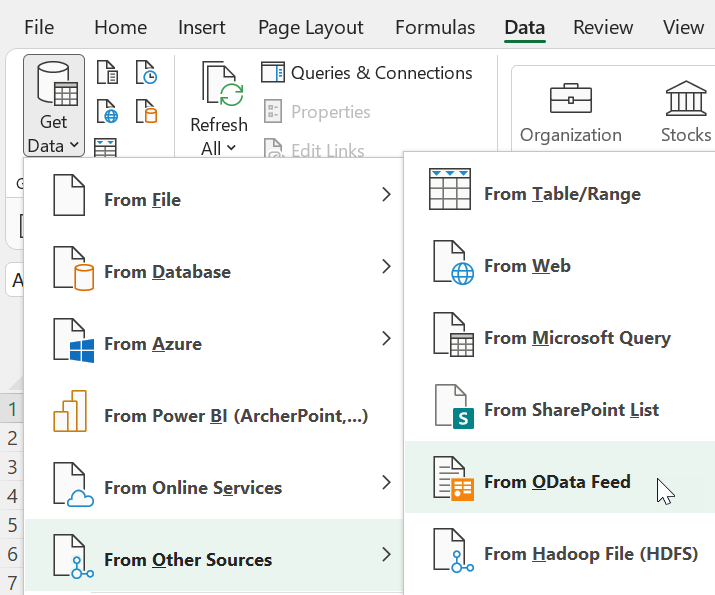
- In Excel, go to the Data tab and select Get Data>>From Other Sources>>From OData Feed.
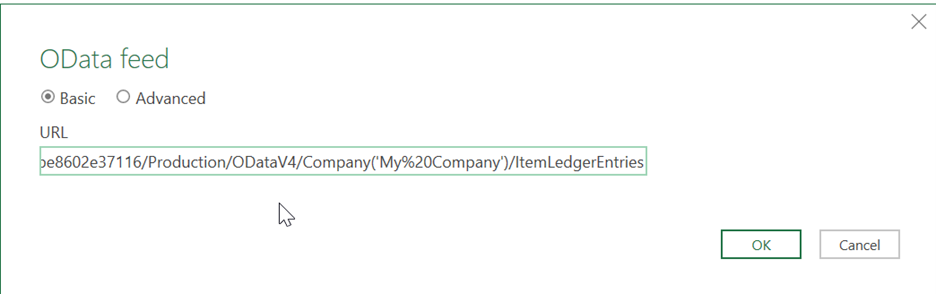
- In the OData Feed menu, paste in the URL you copied from Business Central and select OK.
- Sign into the data source. For Business Central, use “Organizational Account”. Once you click on this option, there will be a sign-in box. Click on that and to start going through the OAuth steps to authenticate.
- After authenticating, you are taken to a preview page. From this page, you can choose to either Load the data into Excel or to Transform the data in Power Query.
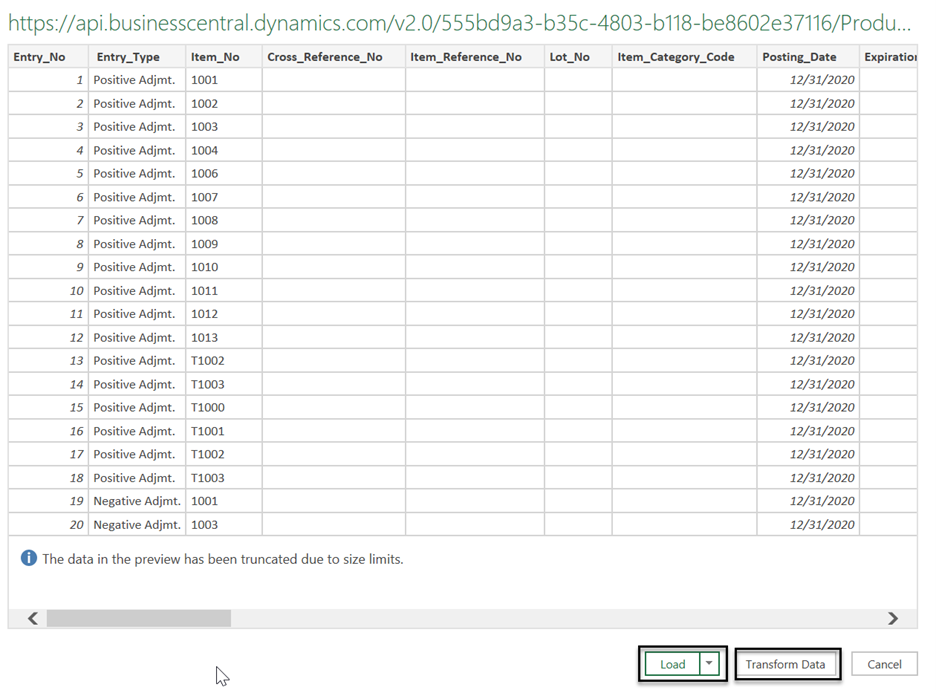
- If you choose to transform, you can remove columns, change data types, add new columns to make the data cleaner, and more. NOTE: We will discuss transforming further in a future post.
- If you choose to load the data, you have two options: Load or Load to.
- Load: Adds the query to Excel as a table
- Load to: Gives you the following options:
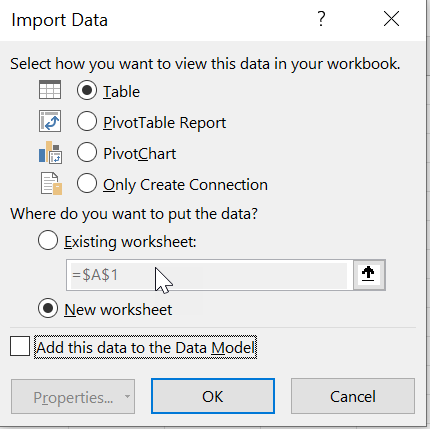
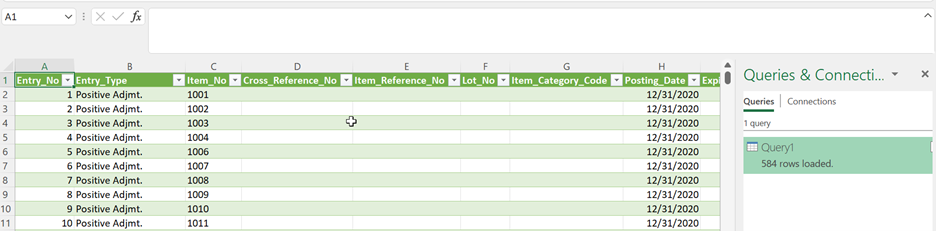
- In this example, we will load the data.
Step 2: Create a Quick Pivot Table
Now that the table with the data from Business Central OData feeds has been loaded into Excel, we can use that table for creating a report. I like to use Pivot Tables, so we will create a Pivot Table from the Item Ledger Entries table.
- Highlight the table and click on the Insert tab; then click on Insert Pivot Table.
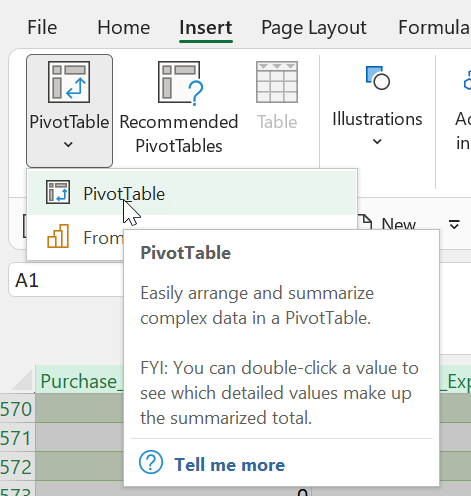
- Although there are options for creating the new Pivot Table, the default options are adequate. Click OK to insert the Pivot Table.
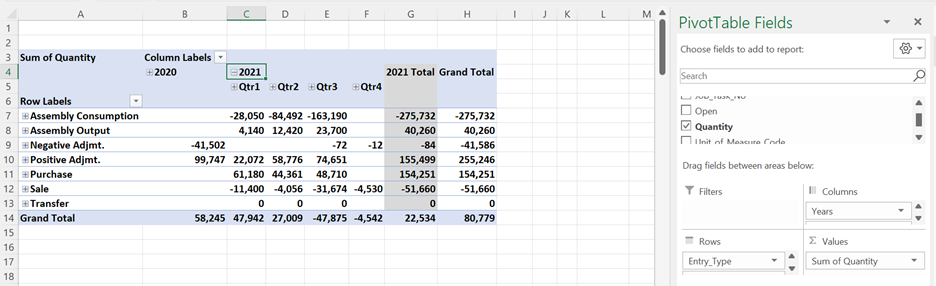
- Create the desired report by adding Rows, Columns, and Values.
To find out more about working with Business Central OData feeds or other areas of Excel and Business Central, contact ArcherPoint.
Read more How-To blogs from ArcherPoint for practical advice on using Microsoft Dynamics 365 Business Central or NAV.
Trending Posts
- Login Error: Communication protocol mismatch between client and server
- How to Make Measures Total Correctly in Power BI Tables
- The Microsoft Technology Stack – What Is It & Why Should You Care?
- MRP vs. MPS: Choosing the Right Planning Approach for Your Manufacturing Business
- Guide to How Manufacturers Can Implement Quality Control Systems Using Business Central
Stay Informed
Subscribe to Communications
"*required" indicates required fields