
Creating a Date Table in Power BI
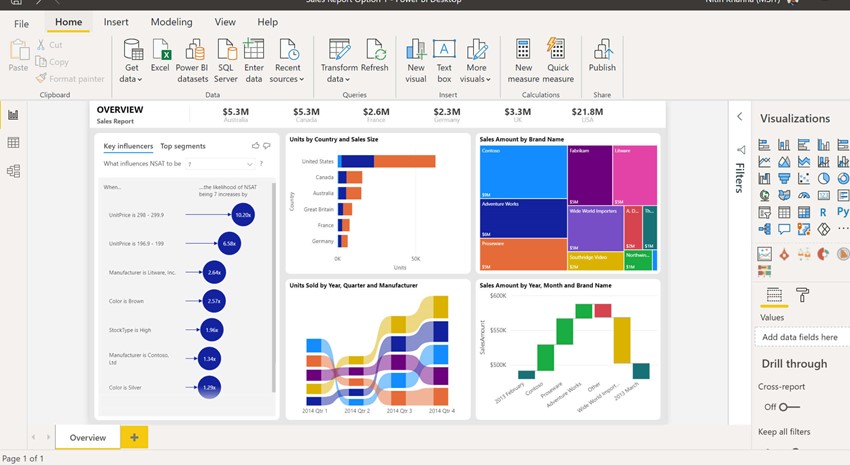
Often when using Microsoft Power BI, you will find that you need a calendar or date reference for your data to organize it by months or weeks, or even the day of the week. If your data has some date information in it but not the specifics you need, building a DAX date table in Power BI can help.
In your report, in the Modeling tab at the top of the Power BI window, select New Table.
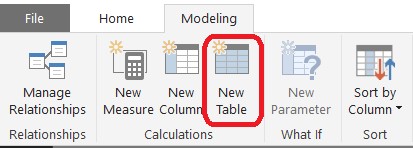
Figure 1 – New Table Option
A new blank table will generate.
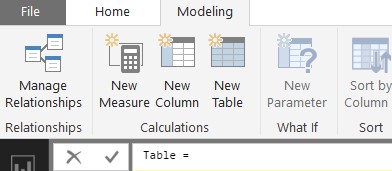
Figure 2 – Blank Table in Power BI
You need to give your table its first column: Date. Remove the word “Table” and replace it with what you want to name your date table. In this example, I have called the table Date. Then use the CALENDAR function to establish what date range you want your table to hold.
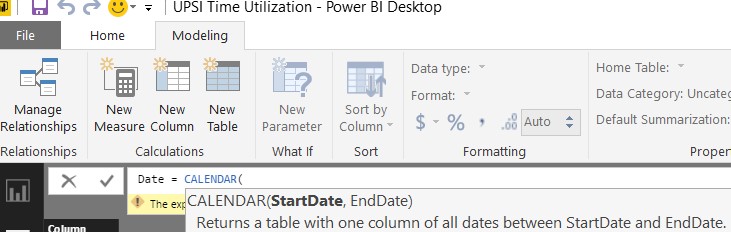
Figure 3 – CALENDAR DAX Function
In the StartDate and EndDate fields of the CALENDAR function, you cannot simply type a date or you will get an error. You have two options: you can set static dates using the DATE function inside the CALENDAR function or you can reference a date-formatted column in your data source. If you use static dates, you will need to make sure the range you enter covers the entire period of your data and goes far enough into the future that you will not have to adjust it any time soon.
Data Source Based Date Range (recommended):
Table Name = CALENDAR (FIRSTDATE(Reference to date formatted column in data source),LASTDATE(Reference to date formatted column in data source))
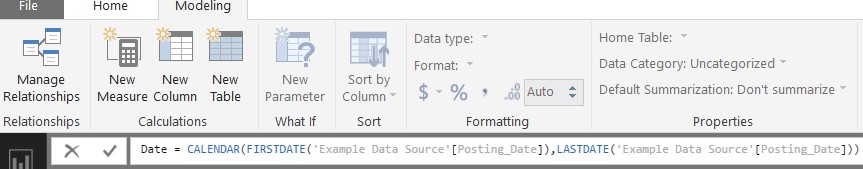
Figure 4 – Data Source Based Date Range
Static Date Range:
Table Name = CALENDAR (DATE(year, month, day)),DATE(year, month, day))
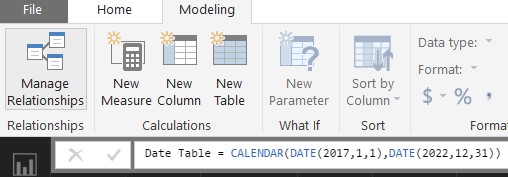
Figure 5 – Static Date Range
Now you have the base starting column listing all dates in the period you specified.
Format the column to fit your needs using the Formatting section in the Modeling tab.
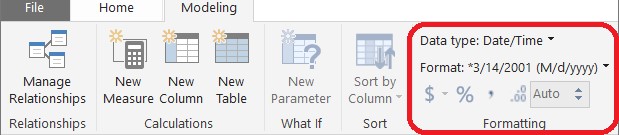
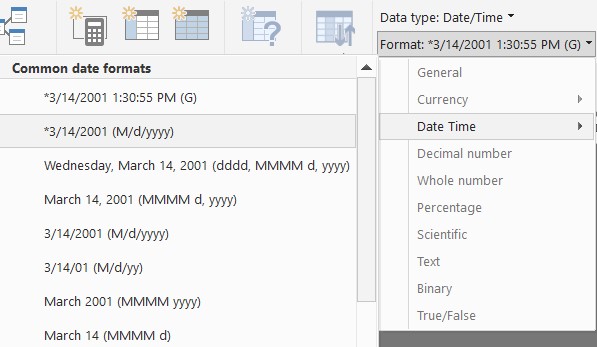
Figure 6 – Power BI Formatting Section
Next, add columns to provide information and categories to the date rage appropriate for your anticipated needs. Here are the most common columns you will use:
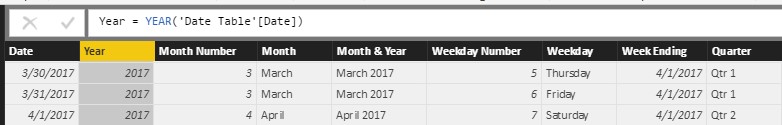
Figure 7 – Year = YEAR (Reference Original Date Column)
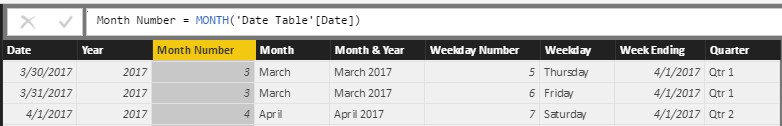
Figure 8 – Month Number = MONTH (Reference Original Date Column)
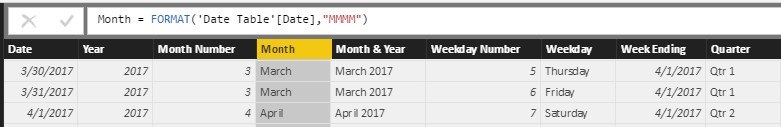
Figure 9 – Month Name =FORMAT (Reference Original Date Column, “MMMM”)
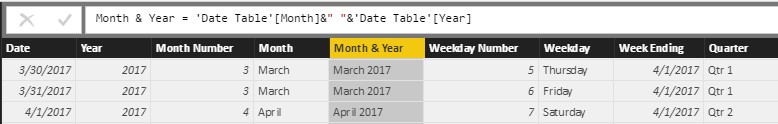
Figure 10 – Month + Year = Reference Month Name & “ “ & Reference Year
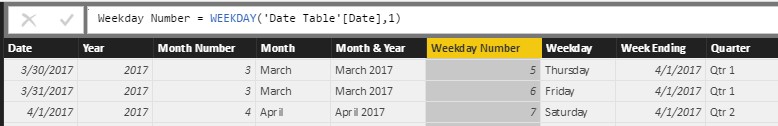
Figure 11 – Weekday Number = WEEKDAY (Reference Original Date Column, 1)
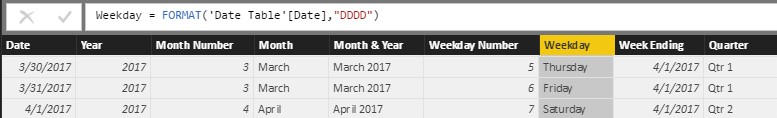
Figure 12 – Weekday Name = = FORMAT (Reference Original Date Column, “DDDD”)
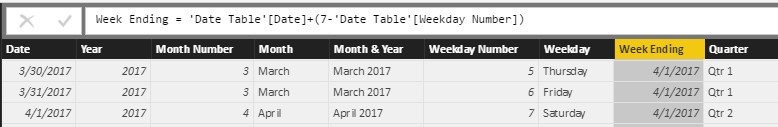
Figure 13 – Week Ending Date = Reference Original Date Column + (7 – Weekday Number)
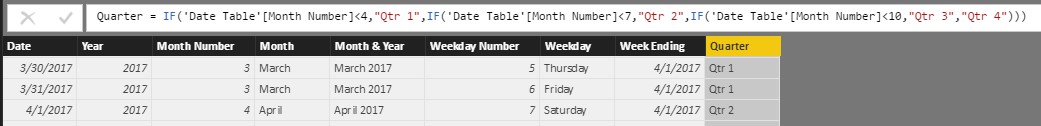
Figure 14 – Quarter = IF(Month Number<4,"Qtr 1",IF(Month Number<7,"Qtr 2",IF(Month Number<10,"Qtr 3","Qtr 4")))
For more DAX date related functions, you can also visit the DAX Function Reference library on the Microsoft Developer Network.
You can use the newly created Date Table in your Power BI report independently, or you can create a relationship between it and your data source (recommended). To link the Date Table and your data source, click the Manage Relationships icon on the right side of the Power BI window.
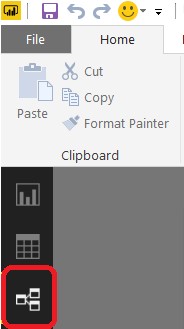
Figure 15 – Power BI Manage Relationships Icon
Then click the Manage Relationships button on the top pane.
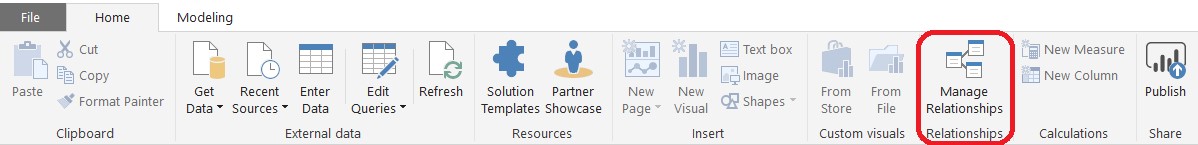
Figure 16 – Manage Relationships Button
Click New and select your data source and the Date Table. Then select the original Date column that created the Date Table and select a date-formatted column in your data source. Cardinality will be One to Many or Many to One depending on what order you selected the two tables. Cross filter direction should be set to Single. The Make this Relationship Active box should be checked. Click OK and your Date Table will be linked to your data source.
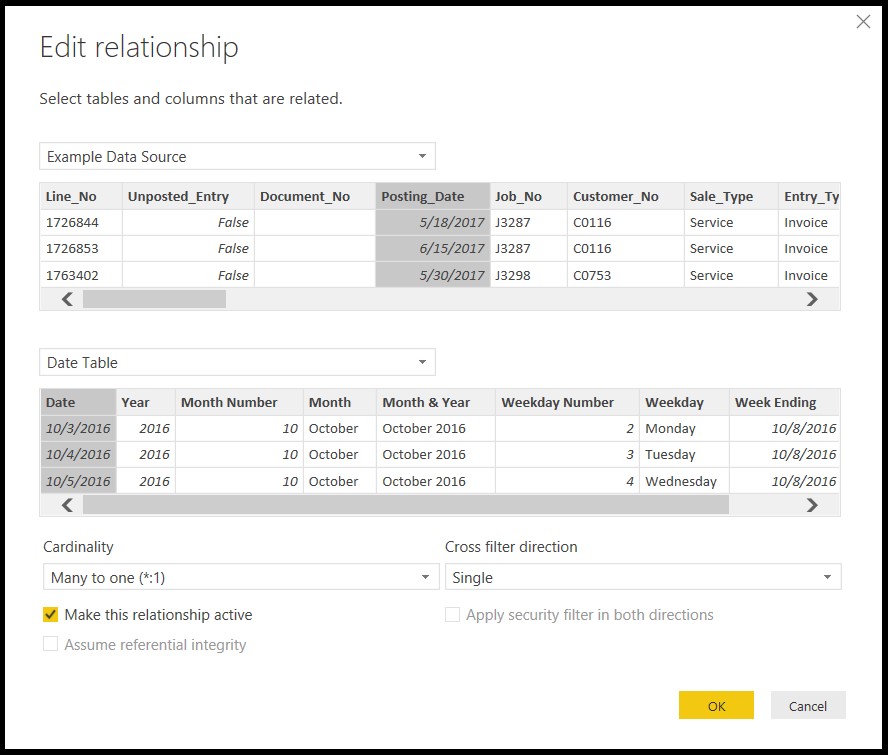
Figure 17 – Data Table Filter
You are now ready to begin using your new Date Table to filter and organize your report.
To find out more about Power BI and Dynamics NAV please visit our resource center, and be sure to subscribe to our blog and newsletters.
Trending Posts
Stay Informed
Choose Your Preferences
"*required" indicates required fields