
How to Make Measures Total Correctly in Power BI Tables

Microsoft Power BI is an excellent tool for creating and publishing dynamic and interactive reports, but it has a few tricky quirks. When creating a Power BI report with a table containing measures, sometimes the columns don’t total correctly.
Those who experience this hurdle may be unfamiliar with how Power BI works or are new to data analysis expressions. Perhaps they used a non-additive calculation. Regardless, the result is an incorrect total. That’s where this guide comes in.
What Are Measures in Power BI?
A Power BI new measure derives from DAX formulas. Measures analyze and summarize data in a visual format, such as tables and charts. This feature allows users to perform calculations based on specific requirements and business logic.
As a result, users can derive meaningful insights from the visualized and calculated data to make fast, data-driven decisions. For example, measures answer questions like “What is the total sales revenue?” or “What are the average sales per customer?” in our Power BI dashboards and reports.
It’s a powerful feature for businesses of all sizes and industries. However, upon double-checking its calculations, you might notice the Power BI total is not correct.
Why Power BI Totals Might Seem Wrong
Power BI always computes what you ask it to compute — it never changes the semantics of your formulas. When you use measures on a table’s rows, Power BI will not calculate the column’s total based on the sum of the rows’ results. Instead, it calculates using the same formula and applies it to the selected data’s total.
Here are a few possible reasons a Power BI table may be incorrect when using measures.
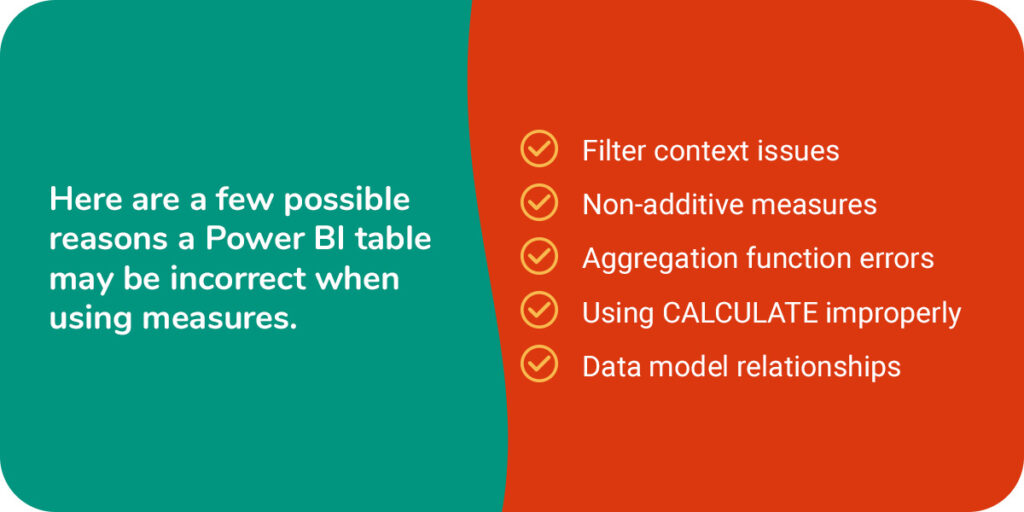
- Filter context issues: Power BI calculates measures based on the current filter context, which can change depending on slicers or visual filters. When viewing totals, the filter context might differ from individual rows.
- Non-additive measures: Power BI cannot sum some calculations across rows. For example, summed averages don’t yield a correct overall average, as the total may misrepresent the actual data.
- Aggregation function errors: If a measure uses an inappropriate function — like using a SUM formulafunction instead of AVERAGE — it can cause an aggregate function error resulting in the wrong total.
- Using CALCULATE improperly: If you use the CALCULATE function incorrectly, it may show inaccurate totals that don’t reflect what you expect from the underlying data.
- Data model relationships: Having incorrect or missing relationships between tables in a data model can result in measures that do not aggregate correctly across related tables.
How to Make Measures Total Correctly
To correct the totals not calculating correctly, create a secondary measure that works around the default totaling calculation.
In this example, the table shows the following:
- List of projects
- Budgets for the projects
- Expenses for the projects
- Remaining budget for the projects
Power BI calculates the budget remaining column using a measure that subtracts the budget amount from the posted expenses. Since Power BI calculates the measure on each row, the table shows an incorrect total in the budget remaining column.
- Formula: Budget Remaining = IF(SUM([Budget Amount])=0,BLANK(),(SUM([Budget Amount]))-SUM([Posted Expenses]))
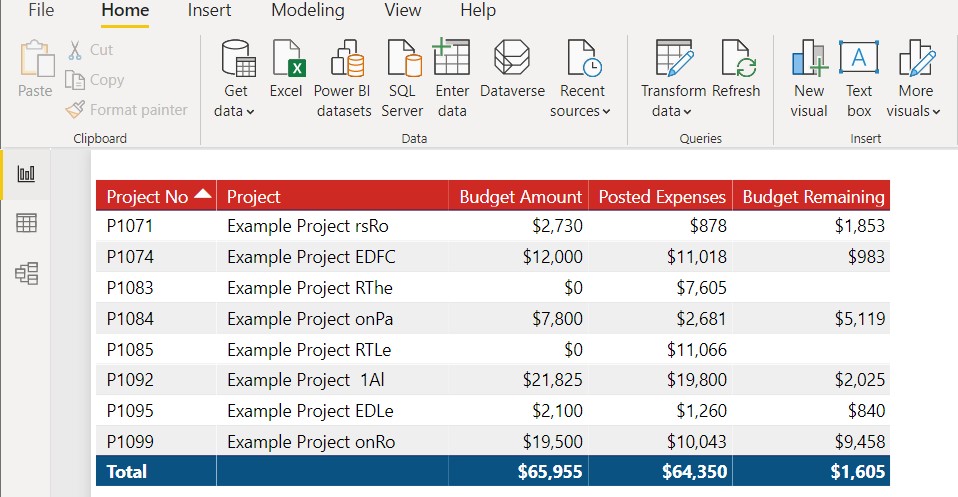
In this table, the total displayed in the budget remaining column does not sum the column. Instead, it takes the total budget amount sum for all rows and subtracts the total posted expenses sum for all rows. Since two of the projects in the table don’t have a budget, $1,605 is not the accurate total of the budget remaining column.
To correct this, you need to make a second measure as a workaround. For example, you can use an IF statement to tell Power BI not to count a totaling row. Alternatively, you can use the HASONEFILTER formula to do the same thing. You will keep the original measure formula the same, and this second one will build on it.
For the workaround measure, use an IF statement to state if Power BI should count a row because it has values, then provide the original measure of budget remaining. Use a SUMX formula if you do not want Power BI to count a totaling row.
- Budget Remaining Correct = IF(COUNTROWS(VALUES([Project No]))=1,[Budget Remaining],SUMX(VALUES([Project No]),[Budget Remaining])
You can also use the HASONEFILTER version of this solution to get the same result. This formula looks for rows with one filter rather than counting the rows with values:
- Budget Remaining Correct = IF(HASONEFILTER([Project No]),[Budget Remaining],SUMX(VALUES([Project No]),[Budget Remaining]))
Either formula usually produces the correct totals. Depending on your data’s complexity, you might find one works better.
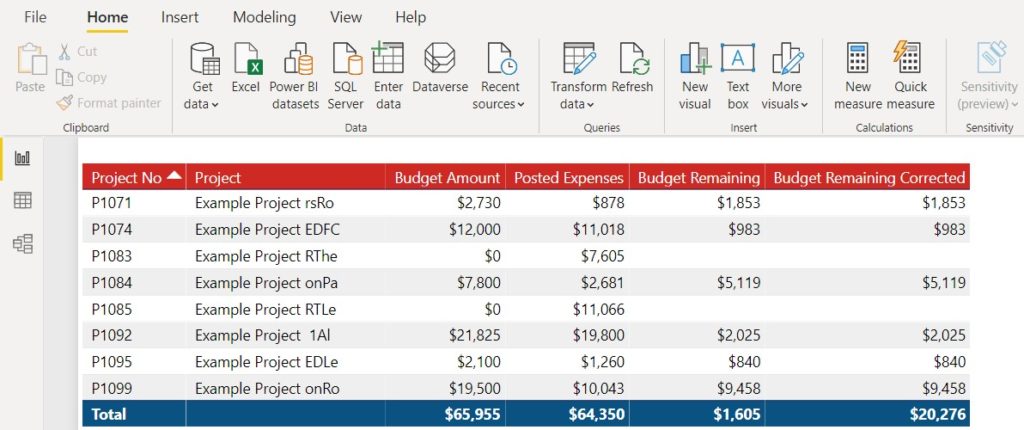
You will now see the original budget remaining measure showing an incorrect total and the secondary workaround with the corrected budget total.
To clean up the report, rename your two measures and remove the original measure from the table so only the correct workaround shows.
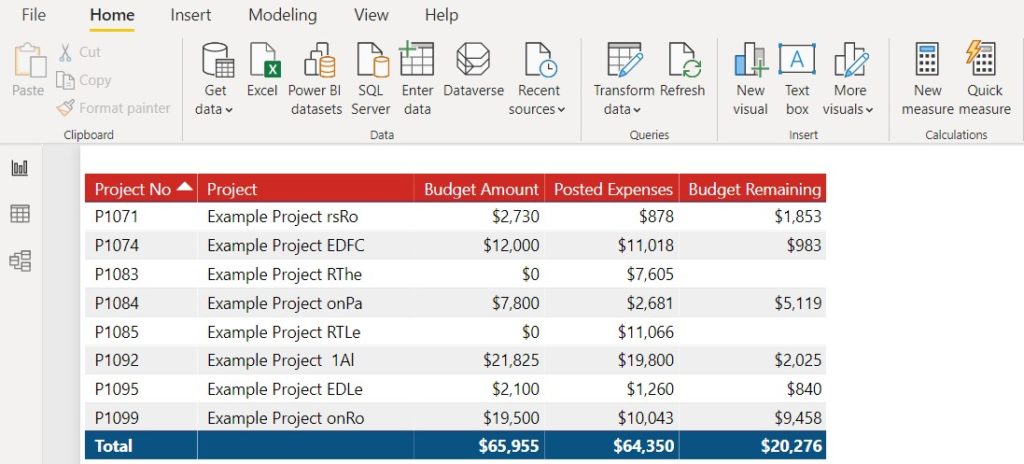
Now you have a table in your Power BI report that displays a correct total for rows that use a calculated Measure.
You can find more information from Microsoft about the DAX formulas used in this blog here:
Additional Resources
For more information on the DAX formulas used in this guide:
Get Help From ArcherPoint Today

Consider working with ArcherPoint if you need help building your next Power BI report — or your table in Power BI total is not correct. We are a Certified Microsoft Dynamics ERP Solutions Partner with decades of experience. With ArcherPoint, you can learn more about using Power BI in your business and how it integrates with Dynamics 365 Business Central to create real-time reporting options.
Contact our team today to work easier and make smarter decisions.
Trending Posts
- Login Error: Communication protocol mismatch between client and server
- How to Make Measures Total Correctly in Power BI Tables
- The Microsoft Technology Stack – What Is It & Why Should You Care?
- MRP vs. MPS: Choosing the Right Planning Approach for Your Manufacturing Business
- Guide to How Manufacturers Can Implement Quality Control Systems Using Business Central
Stay Informed
Subscribe to Communications
"*required" indicates required fields