
Microsoft Dynamics NAV 2013 RDLC Reporting RBC Attacks: Part 3 of 10

NAV 2013 RDLC Reports can create a vast ocean of issues for the developer to resolve. Yet in the midst of our pain and frustration, there are answers. Within our own developer community, the Dynamics User forum and the Microsoft Business Solutions (MiBuSo) forum are full of answers to RDLC report problems. But…you need to know how to ask the right question in order to get the correct answer from the forum posts.
Let me give you an example about right questions. In the not-so-distant past, a good buddy of mine and I were about to debug a NAV issue. He was running the task from his computer and asked, “Why am I so slow?” I quickly responded, “I don’t know…were your parents related?” You see, getting the RIGHT answer to your problem has a lot to do with the question you ask. As it turns out, he was talking about his connection speed. Who knew?
Now, if your question today is related to slow running NAV 2013 RDLC reports, we may have the answers for you! But, if all your reports are running slowly in NAV, then chances are your solution will be different than if only one report (or a few) are running slowly. If all reports are running slowly, perhaps it’s time to add new server instances for client connections? Or maybe it’s not just reports, and your connection to the database is the problem with overall performance (requiring a different question, as well). These issues aren’t what we’re going to discuss in this blog.
We’re looking at a different question, which is, “What can I do to speed up the processing of one slow NAV 2013 report?” The answer is simple. To run fast, you have to be lean and mean!
RBC 3: Slow running reports
A lot of what happens with a NAV 2013 RDLC report has to do with the dataset. As a NAV developer, there are several things you can do to create a dataset that’s lean and mean, and remove excessive processing, which will speed up your reports.
The first step is to take a look at what’s in your dataset, and compare it to what’s on your report. The dataset can be reviewed using the following steps. NOTE: If you’ve never done this on your client before, you’ll need to follow one quick step before it will show you what you need. Run your report, but when the report opens the request form to Print or Preview – do neither! Instead, pull down on the NAV arrow, and select “HELP” – then “ABOUT THIS PAGE” on the request form of the report. (You only have to do this one time per open of the client.)
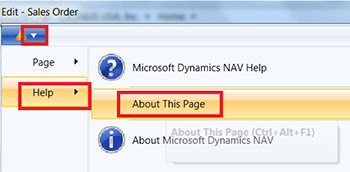
Figure 1 – For slow running reports, first select “Help”, then “About This Page”
Then hit ESCAPE to return to the report request form.
Viewing the Dataset
Preview the report, and select HELP – ABOUT THIS REPORT. You’ll see your dataset on the screen. If you want to do further analysis of the dataset, you can also export it to Excel. When the dataset is displayed on the screen, you can also select “Microsoft Excel” to output it to Excel.’
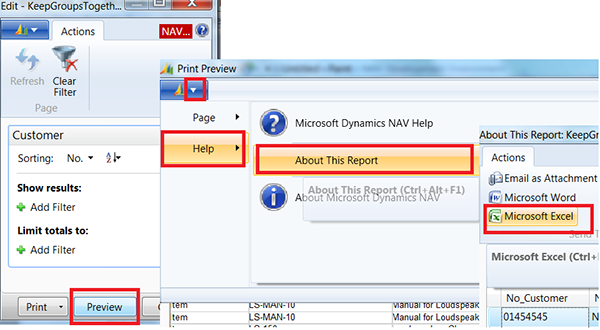
Figure 2 – From About This Report, you can choose to export the dataset to Microsoft Excel
The dataset opens in Excel with one row per dataset record, and field name headings:
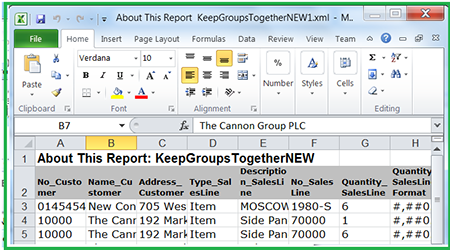
Figure 3 – Screenshot: Viewing the dataset within Excel
This is known as a “Flat Data Set”, which means the tables are joined to make the same data in your first data item appear repeatedly on its indented data items. If you have three tables joined, and the third indented, you’ll have both the first and second table’s data repeated on the third.
Once you can see your dataset, compare it to what is printing (or being used for formatting or calculations) on your report. If it’s not needed, delete it from the Report Designer page that details the dataset, then open the layout and see if the layout compiles. I’d recommend doing this field by field, testing each one, just to be sure it wasn’t required. I also use CTRL-S to save both the layout, and then the report after updating the RDLC – keeping both open – and then run the report to be certain I received no runtime errors. This will save tons of time, because as long as both are open you can still use CTRL-Z to undo your changes.
A Glob of Blobs
BLOB. Even its very name sounds fat, doesn’t it? One of the most common things that cause a report to run slowly is sending a company logo or image through the dataset to the report. When you send the image through your dataset, each and every record receives the BLOB, making that record ‘heavy’ for RDLC processing. How heavy? Well, let’s say you have an image tied to every item. Each image is only 100 KB in size. But – you have 200,000 items, and you are sending the blob through your database to Visual Studio to produce a report. Do the math: ((100kb * 200,000 = Fatness!) = slowness!).
Instead, how about sending the hyperlink to the file to the dataset and linking it to the item number? The user can see the picture by clicking the hyperlink, which is far smaller in the dataset than 100kb!
The Company Logo is a prime example of a way to cut fat out of a dataset. NAV document reports often show the field multiple times, but don’t let that scare you. Usually only one is calculated (e.g., Report 10074 Sales Invoice), and if only one is calculated, then the “fat” is only in that one dataset field. But does it have to be on every record? NO! You don’t have to put it in the dataset at all. You can embed the image. Take a look below at the Visual Studio Image Properties window. Pull down on the Image Source, and change it to Embedded. Then use the IMPORT button to set the location of the file.
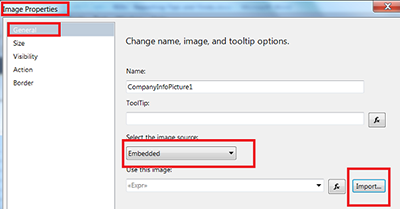
Figure 4 – You have the option to embed an image to help speed up slow running reports
There are pros and cons to embedding an image. Pro: You see the image on the report layout in Visual Studio and you have a smaller dataset. Cons: If you embed the image, changing the logo in NAV Company Information page will have no effect on your report. You will also have to change the logo that you have embedded. You will also have to go and embed it again – even if you saved it to the same name, same location. Visual Studio does a funny numbering trick when you change an embedded image whereby LOGO becomes LOGO1. And if you import again, it becomes LOGO2 – even if the file name is the same. You can also set the image to EXTERNAL, and enter the URL for the image. I won’t comment on that because I’ve never tried it.
Captions Cravings
Captions to fields are another way the dataset is increased and made “fat”. Don’t habitually click the “Include Caption” box on the Report Dataset Designer page! Each caption comes through as part of the dataset as well.
If you’re writing a report that has a lot of captions, think about using Labels instead. Oh, labels are sweet – and much better than manually entering the captions in the RDLC report layout! Labels are sent ONCE to Visual Studio as Report Data, and can be found under PARAMETERS when creating the text box expression to use them.
There is a small, teeny tiny issue with labels though. While in Visual Studio and changing your report layout, you can go back to the NAV report designer, add fields to the dataset and update it using View – Report Data – and right click on DataSource to select REFRESH. But, with labels (which are not in the DataSource of the report data but listed under PARAMETERS instead), you can’t just refresh them. If you need to add a label to the Report Data, you will need to close the layout, add it to NAV, then reopen the layout.
Data Snacking
If you’re not going to print it – don’t send it! Sometimes it’s as simple as not sending all the data read to the dataset. We’ve already stated that you should only send the fields you are going to print, but think about the records as well. If I’m setting a tablix filter to only print items that have an inventory value, then, geez, why send those sad little records only to be rejected? Nobody likes rejection! Set filters on your report DataItem to reduce the amount of data read when possible. If that’s not possible, use a temporary table and load it up with only the records you need, using it as the basis for your dataset.
Think Process
If you have one report that will be run on the same records multiple times a day to calculate the same results, then…think: Could the calculations be done and stored on the records when they are created, or at some other time than during each run of the report? Sometimes the report is doing the best it can with a broken process. Go upstream and correct the data and you could clean up a bottleneck on the report processing.
Code Smart
It’s not always the RDLC portion of a report that causes it to be slow. Look at your code with an eye for anything you can do to speed up the processing. Here are some easy tips:
- Use flowfields instead of reading tons of records for a total.
- Use CalcSums and SumIndexFields to quickly retrieve totals.
- Use the best key for your filter set, and filter in order of the key fields.
- Set data item filters in data item properties or the OnPreDataItem trigger, rather than in the OnAfterGetRecord trigger.
This is all old news to a seasoned developer, but good code is essential to good report performance.
Did I Miss Something?
You may have other ways you’ve learned for speeding up the processing of your reports. If so, don’t keep the good news to yourself – share! Comment below and share your tips.
(Some of the things I’ve learned about RDLC reporting came from the RDLC Brain Cramps I’ve endured. But many of the tips and tricks I’ve learned came from a short and painless class provided by MergeTool, and taught by Claus Lundstrom. Claus was the program manager for NAV Reporting in 2013. If you’re interested in his classes, or interested in learning more, please visit Claus’ blog.)
ArcherPoint is delighted to offer tips to developers throughout the NAV community, but code samples are not warranted, as all installations are different. It is advised that the developer verify that the solutions work for his or her installation of Dynamics NAV before implementing the code.
Read Part 2 of the RDLC Reporting Brain Cramps (RBC) series here.
Read more developer blogs by Faithie Robertson. For more information on topics related to Microsoft Dynamics NAV development, read the ArcherPoint Developer Blog, written specifically for Dynamics NAV developers, or contact ArcherPoint directly.
Trending Posts
- Login Error: Communication protocol mismatch between client and server
- How to Make Measures Total Correctly in Power BI Tables
- The Microsoft Technology Stack – What Is It & Why Should You Care?
- MRP vs. MPS: Choosing the Right Planning Approach for Your Manufacturing Business
- Guide to How Manufacturers Can Implement Quality Control Systems Using Business Central
Stay Informed
Subscribe to Communications
"*required" indicates required fields