
Master Financial Reports in Business Central (without using Excel!)

The month-end reporting problem nobody talks about
It’s 6:47 PM on the last Friday of the month. Your controller just emailed you — again — with a revised P&L. This is version seven. The file is named PL_Final_FINAL_v3_JulieFixes_REAL.xlsx. Sound familiar?
Here’s the uncomfortable truth: Most finance teams running Business Central are still exporting raw trial balance data into Excel, manually building reports, and praying that the formulas didn’t break when someone inserted a row. They do this month after month. Meanwhile, a powerful, built-in financial reporting engine sits right inside their ERP, untouched.
Financial Reports in Business Central is that engine! If you’re coming from NAV or earlier BC versions, you might know this feature as Account Schedules — it was renamed in BC 2022 Wave 2 (v21, October 2022) and enhanced. The Financial Reports feature is not new. It’s not an add-on. It’s not an extra license. And yet, it remains one of the most underutilized features in the entire platform.
This guide will change that. Whether you’re a BC beginner setting up your first report or a CFO looking to slash your reporting cycle from days to minutes, everything you need is right here — and you can follow along using the free Cronus demo company.
What are Financial Reports in Business Central?
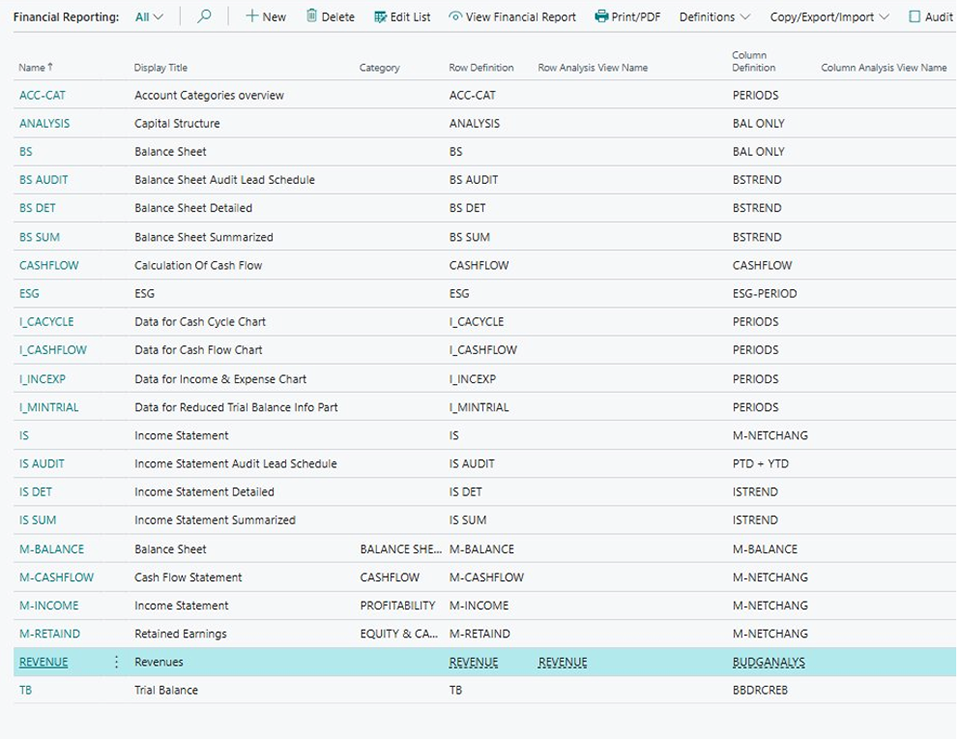
Think of Financial Reports (Figure 1) as a reporting workbench built directly into Business Central. Unlike canned reports that give you a fixed view, Financial Reports let you design exactly the financial statement you need — an Income Statement, a Balance Sheet, a departmental P&L, a budget variance analysis, or anything else your board demands.
The magic comes from three simple building blocks:
The Three Building Blocks
| Building Block | What It Does | Analogy |
| Row Definition | Defines what appears on each row — G/L accounts, totals, formulas, headings | The skeleton — line items down the left side |
| Column Definition | Defines what appears in each column — actuals, budgets, variances, periods | The lens — how you look at the numbers |
| Financial Report | Combines one Row Definition + one Column Definition into a viewable report | The finished photograph — skeleton meets lens |
The beauty of this design? You can mix and match. One Row Definition can be paired with different Column Definitions — one for “Actual vs. Budget,” another for “This Year vs. Last Year,” a third for “Monthly Trend.” Three completely different executive reports, built from the same foundation.
Walkthrough: Building your first financial report
Let’s get hands-on. We’ll build a simple Income Statement from scratch using the Cronus demo data in BC28. Even if you’ve never opened this feature before, you’ll have a working report in about 15 minutes.
Step 1: Create a Row Definition
The Row Definition is your report’s backbone. It lists the accounts and totals that will appear as line items.
1. Search for “Row Definitions” and open the list.
2. Click + New to create a blank Row Definition.
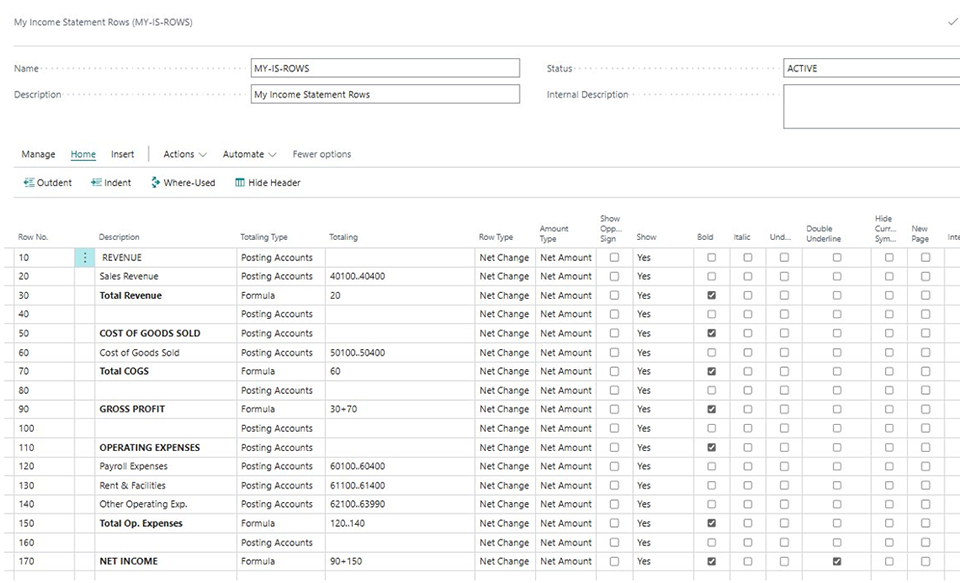
3. Give it a name: MY-IS-ROWS (Figure 2). Keep it short — the Name (code) field on Row Definitions is limited to 10 characters.
4. Important (BC28+ only): Starting with Business Central 2026 Wave 1 (v28), Row Definitions, Column Definitions, and Financial Reports have a Status field. If your environment is on BC28+, change the Status from Draft to Active so the definition isn’t blocked. On BC27 and earlier, this field doesn’t exist, so you can skip this step.
Now populate the rows. Here’s a simplified structure using Cronus G/L Account ranges:
| Row No. | Description | Totaling Type | Totaling | Show |
| 10 | REVENUE | Posting Accounts | (leave empty) | Yes (Bold) |
| 20 | Sales Revenue | Posting Accounts | 40100..40400 | Yes |
| 30 | Total Revenue | Formula | 20 | Yes (Bold) |
| 40 | (leave empty) | Posting Accounts | (leave empty) | Yes |
| 50 | COST OF GOODS SOLD | Posting Accounts | (leave empty) | Yes (Bold) |
| 60 | Cost of Goods Sold | Posting Accounts | 50100..50400 | Yes |
| 70 | Total COGS | Formula | 60 | Yes (Bold) |
| 80 | (leave empty) | Posting Accounts | (leave empty) | Yes |
| 90 | GROSS PROFIT | Formula | 30+70 | Yes (Bold) |
| 100 | (leave empty) | Posting Accounts | (leave empty) | Yes |
| 110 | OPERATING EXPENSES | Posting Accounts | (leave empty) | Yes (Bold) |
| 120 | Payroll Expenses | Posting Accounts | 60100..60400 | Yes |
| 130 | Rent & Facilities | Posting Accounts | 61100..61400 | Yes |
| 140 | Other Operating Exp. | Posting Accounts | 62100..63990 | Yes |
| 150 | Total Op. Expenses | Formula | 120..140 | Yes (Bold) |
| 160 | (leave empty) | Posting Accounts | (leave empty) | Yes |
| 170 | NET INCOME | Formula | 90+150 | Bold, Dbl Underline |
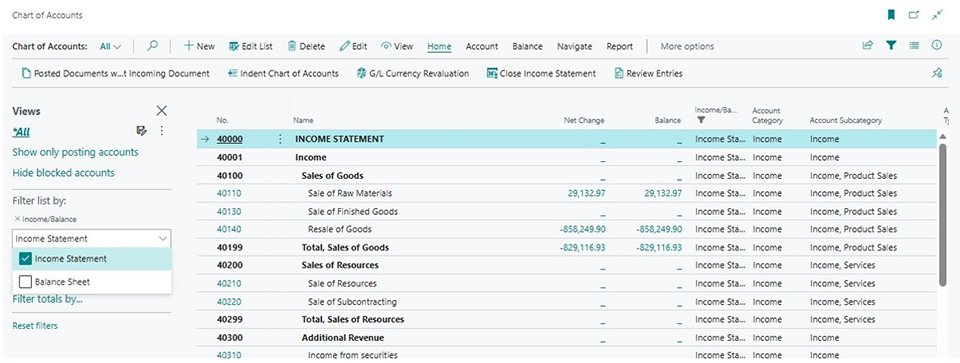
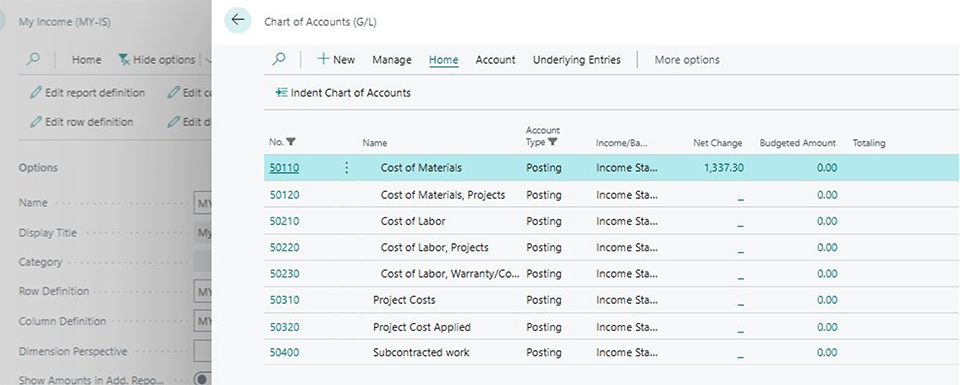
Note: In practice, you’ll find Totaling Type is almost always set to Posting Accounts by default on new rows. To create a heading row, keep it as Posting Accounts, but leave the Totaling field empty — an empty account range means no data, just a label. Check Bold to make it stand out. For blank separators, leave both Description and Totaling empty. Important: the account ranges above are illustrative only. Always check your own Chart of Accounts (Figure 3) before copying these ranges — Cronus numbering varies across localizations, and your production COA will almost certainly differ.
Note on Row Type: Each row also has a Row Type field that, in most versions, defaults to Net Change — this is correct for Income Statement accounts (revenue and expenses). If you build a Balance Sheet report later, you’ll need to set Row Type to Balance at Date for asset, liability, and equity rows.
Step 2: Create a Column Definition
Now, let’s define how we want to view the numbers. We’ll start simple.
1. Search for “Column Definitions” and open the list.
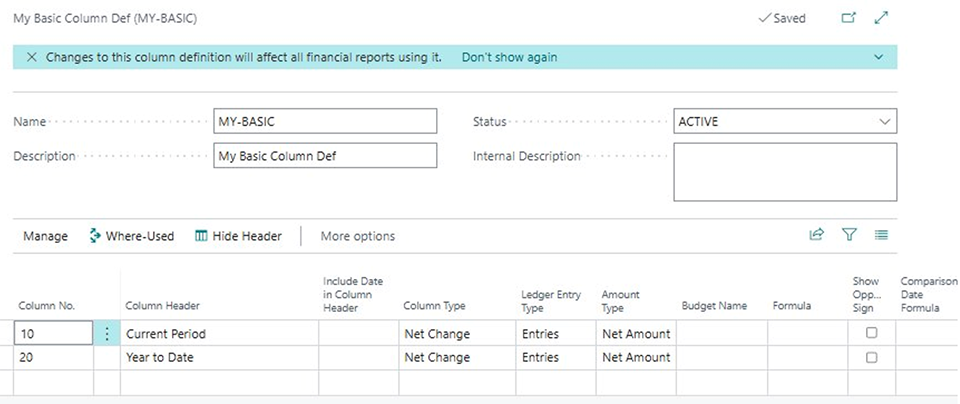
2. Click + New and name it: MY-BASIC (Figure 4).
3. (BC28+ only) Change the Status from Draft to Active — a Draft column definition will be blocked on Financial Report.
4. Add these columns:
| Column No. | Column Header | Column Type | Ledger Entry Type |
| 10 | Current Period | Net Change | Entries |
| 20 | Year to Date | Net Change | Entries |
The date range is not set in the Column Definition — it’s controlled at runtime via the Date Filter on the Financial Report page.
Step 3: Bring it together: Create the financial report
1. Search for “Financial Reports” and click + New.
2. Name it: MY-IS (like the built-in names: IS, BS, M-INCOME).
3. Set Row Definition to MY-IS-ROWS and Column Definition to MY-BASIC.
4. (BC28+ only) Change Status from Draft to Active. All three components must be Active. If any are Draft, the report shows Blocked.
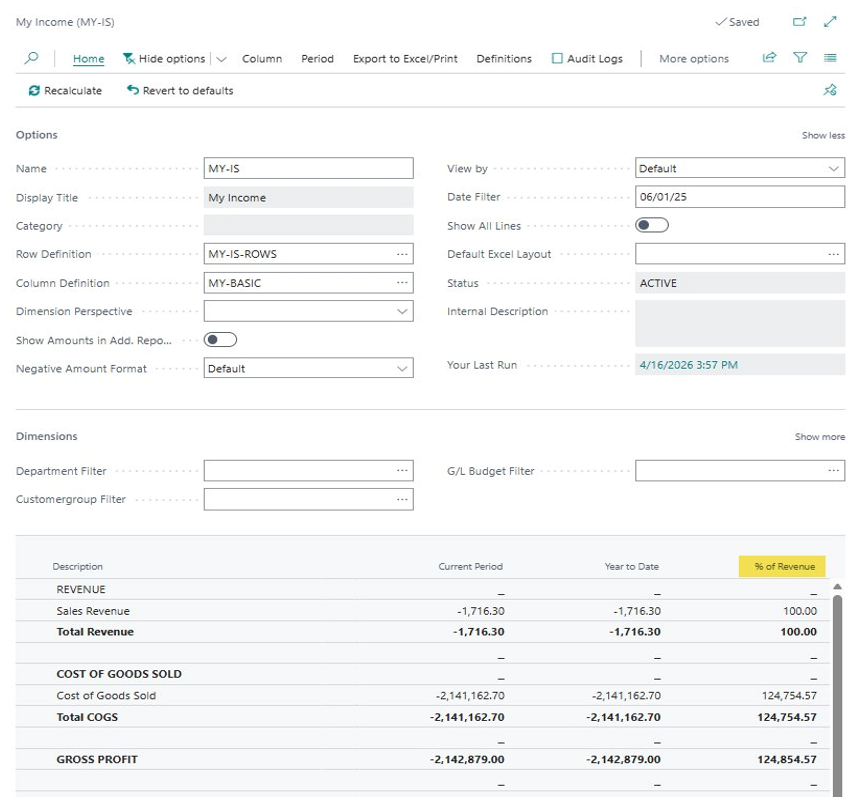
5. Click Edit Financial Report to preview. Set your Date Filter (e.g., 06/01/25) and watch the numbers populate (Figure 5).
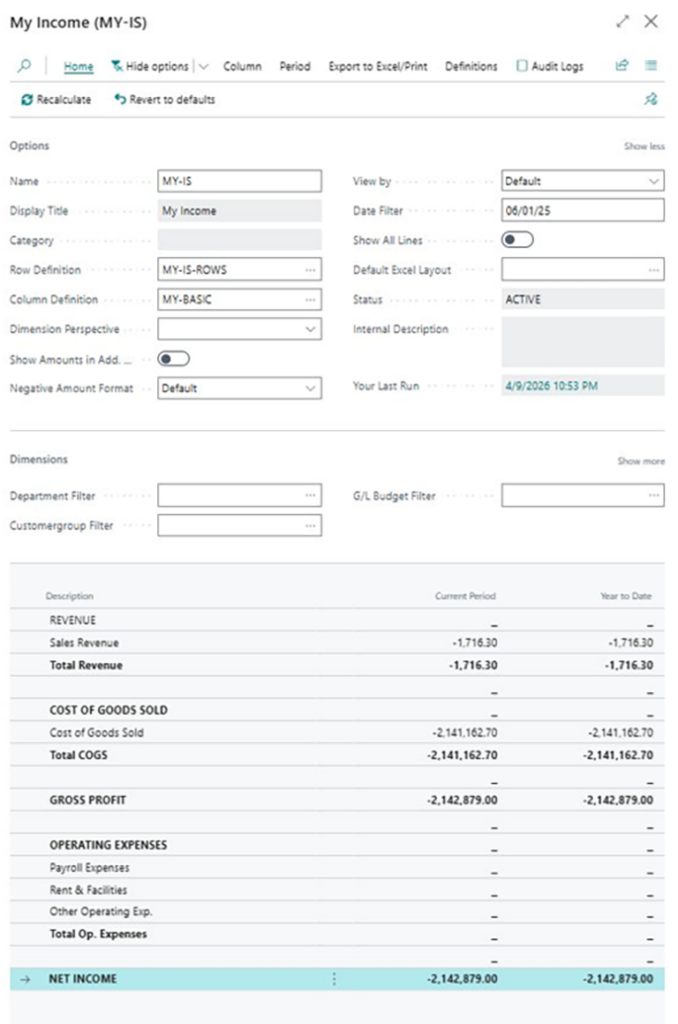
Congratulations! You just built your first Financial Report from scratch!
Did you notice the negative revenue? Sales Revenue shows as -1,716.30 and Net Income as -2,142,879.00. That’s because revenue accounts in BC carry credit balances. Jump to Pro Tip #4: Show Opposite Sign & Row Formatting below to learn how to fix this.
Power features that will impress your board
Power feature #1: Use Dimension Filters to create a P&L in Business Central to see your business by department
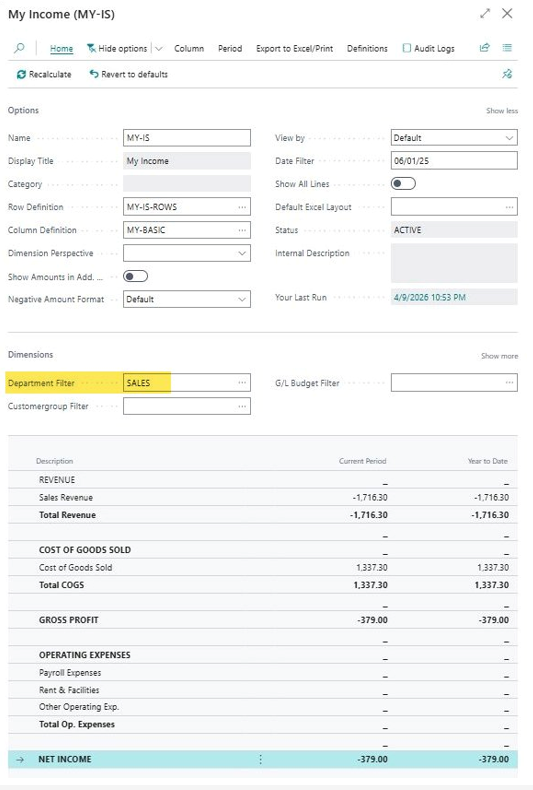
Business Central’s Dimensions are metadata tags attached to every transaction. On any Financial Report, set the Department Filter (Figure 6) and your Income Statement instantly becomes a departmental P&L.
CFO Insight: This replaces 80% of the “Can you slice this by department?” requests your team gets every month.
Power feature #2: Budget vs. Actual with Variance columns
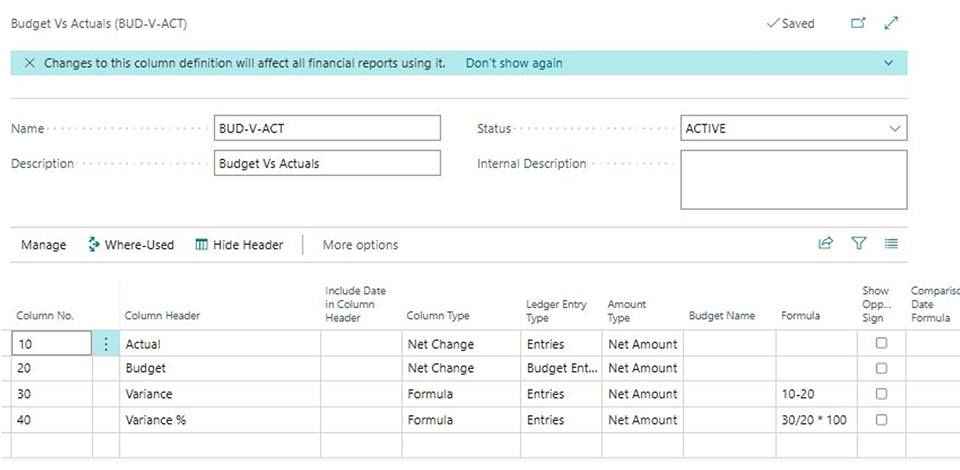
Create a new Column Definition called BUD-V-ACT (Figure 7) with four columns: Actual (Net Change, Entries), Budget (Net Change, Budget Entries), Variance (Formula: 10-20), and Variance % (Formula: 30/20*100).
Now, when you view the report, you’ll see four columns side by side — no Excel formulas needed.
Note: For the Budget column to show data, the Cronus demo must have G/L Budget entries. Search for “G/L Budgets” to verify.
Power feature #3. YoY Period Comparisons
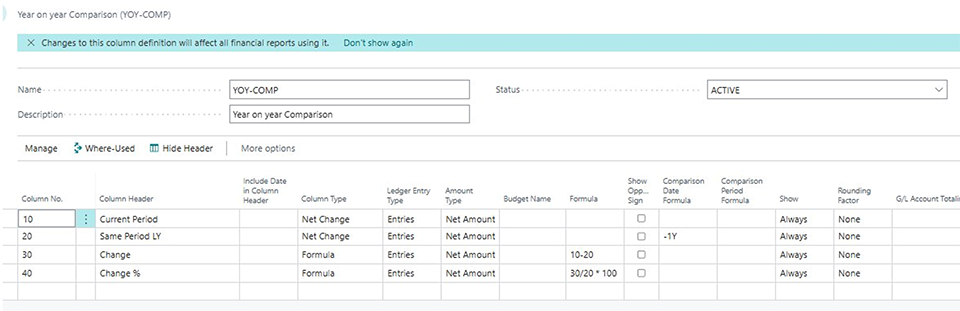
Similarly, create a new Column Definition called YOY-COMP (Figure 8) with four columns: Current Period (Net Change, Entries), Same Period LY (Net Change, Entries, with Comparison Date Formula set to -1Y), Change (Formula: 10-20), and Change % (Formula: 30/20*100).
The Comparison Date Formula is the magic here. -1Y means “same period, one year ago.” Other useful formulas: -1M (prior month), -1Q (prior quarter). Just swap the Column Definition on your MY-IS report and the comparison appears instantly.
Power feature #4. Drill-Down – From Report to Transaction
When viewing a Financial Report, click on any number in a cell that pulls from G/L accounts. BC will immediately open the underlying G/L Entries with posting dates, document numbers, and source codes (Figure 9).
Note: Drill-down only works on cells from Posting Accounts, Total Accounts, or Account Category rows. You cannot drill down on Formula rows or columns.
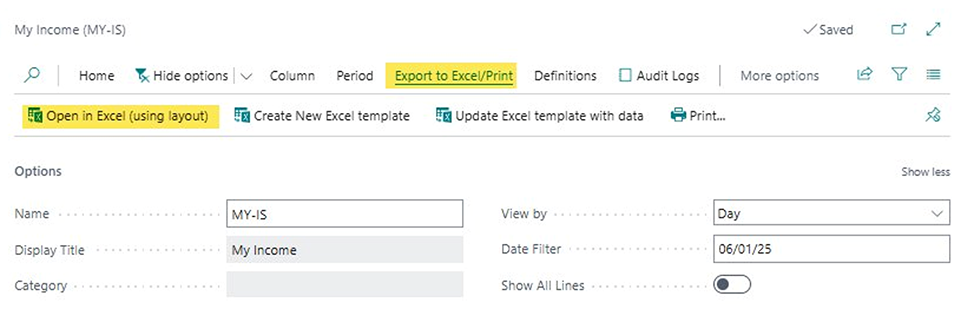
Power feature #5. Export to Excel & Excel layouts
Every Financial Report can be exported to Excel (Figure 10) with a single click. Starting with BC 2025 Wave 1 (v26), you can save Excel templates in Business Central and run reports using saved templates via Open in Excel (using layout). The raw data goes to a hidden sheet; your formatted sheet references it.
Real-world scenarios every CFO cares about
Scenario #1: Departmental P&L
Standard Income Statement Row Definition + Net Change column for the current month + Department dimension filter. Each department head sees their numbers exactly.
Scenario #2: Board-ready Budget Variance report
Detailed P&L Row Definition + BUD-V-ACT column definition. Export using a saved Excel template with conditional formatting for a polished board package.
Scenario #3: Cash Flow snapshot
Use the built-in Cash Flow Statement Row Definition from Cronus. Pair with monthly trend columns (12 columns, one per period). A 12-month waterfall without external tools.
Scenario #4: Quick KPI dashboard for the CEO
Compact Row Definition with 8–10 rows: Total Revenue, Gross Margin, EBITDA, Net Income, AR/AP/Cash Balances. Column Definition with Current Month, YTD, and Same Period Last Year. One page, nine numbers, three perspectives.
Tips and tricks: The expert’s playbook
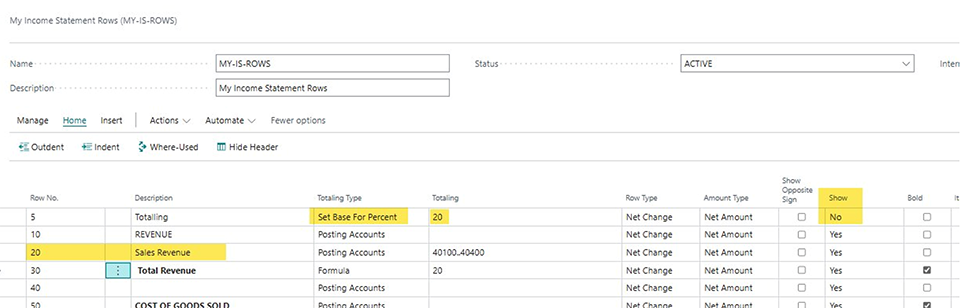
Pro Tip #1. “Set Base for Percent” Totaling Type
This step requires setup in both Row and Column Definition. Add a row with Totaling Type = Set Base for Percent (Figure 11) as the very first row in your Row Definition (before any data rows), with Show set to No. Then in the Column Definition, add a Formula column with the formula 10% (where 10 is your Current Period column number). This produces a common-size Income Statement in which every line is expressed as a percentage of revenue (Figure 12).
Pro Tip #2. Copy and reuse definitions
On the Financial Reports page, use Copy Report Definition to duplicate an entire report. For Column Definitions, use Import/Export actions to share between companies.
Pro Tip #3. Date formulas that save time
| Formula | Meaning |
| CM | Last day of the current month |
| -1M | Last day of the previous month |
| CQ | Last day of the current quarter |
| CY | Last day of the current year |
| -1M..CM | Last month through the current month |
Note: these formulas return a single date (the last day of the period), not a range. To filter across a period, combine them with the range operator — e.g., -CM..CM for the full current month, or -CY..CY for the full current year.
Important: Don’t confuse Date Filter formulas with Comparison Date Formulas in the Column Definition. The Comparison Date Formula (e.g., -1Y) is a separate field that shifts the period relative to the Date Filter.
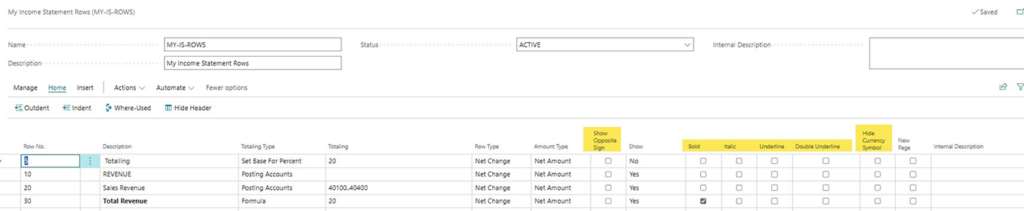
Pro Tip #4. Show opposite sign and row formatting
Revenue accounts in BC post as negative amounts (credit balances). The Show Opposite Sign checkbox on a Row Definition row flips the sign so revenue appears positive — the way your board expects. Apply it only to the posting-account row where the sign needs to flip. Using it on a formula row, such as Gross Profit, where both revenue and COGS are aggregated, produces an incorrect result because the sign is flipped after aggregation is complete. The Row Definition also offers Bold, Italic, Underline, and Double Underline toggles for each row. These carry through to printed/PDF versions. Per Microsoft Learn, some formatting doesn’t carry over to Excel exports—apply it in the Excel template instead. Figure 13 shows all these columns highlighted.
What’s new in BC 2026 Wave 1 (v28)
- Company logo on PDF outputs.
- Report Categories and Statuses (Draft, In Review, Published).
- Scheduled distribution to a distribution group with report inbox delivery.
- Combine multiple reports into a single PDF for easier sharing.
- Run reports over all values of a dimension in one action.
- Global defaults for negative format, report period, and logo placement.
- Enhanced audit log tracking who ran which report and when.
- New tile/card view on the Financial Reports list.
What’s next?
This blog covered the foundations of Financial Reports in Business Central. There’s a lot more to explore — Power BI integration, Copilot for finance analysis, multi-company consolidation, and API access. We can deep dive into any of these topics based on your needs. Contact ArcherPoint by Cherry Bekaert to find out more. And check out our collection of How-To blogs to learn more about getting the most from Business Central.
Trending Posts
- Login Error: Communication protocol mismatch between client and server
- How to Make Measures Total Correctly in Power BI Tables
- The Microsoft Technology Stack – What Is It & Why Should You Care?
- MRP vs. MPS: Choosing the Right Planning Approach for Your Manufacturing Business
- Guide to How Manufacturers Can Implement Quality Control Systems Using Business Central
Stay Informed
Subscribe to Communications
"*required" indicates required fields