
BI Tools for Dynamics Business Central and NAV: Which One Is Right for You?

Today, the business world is user-centered, with self-service reporting available to allow decision makers to get their reports the way they want them. The question is, which business intelligence tools (BI) are the best? In this article, we take a closer look at BI tools for Microsoft Dynamics 365 Business Central (BC) and Dynamics NAV.
Understand Your Database
To understand how to look at BI tools for Business Central and NAV, it is important to first understand how they store data. If you have ever seen an Excel spreadsheet, then you have seen the structure of a database. Rows, columns, and sheets form the structure in Excel while a database uses records, fields, and tables. Though the names are different, the structure is the same. A database can consist of many tables in the same way an Excel document can have many sheets. BC and NAV run on a normalized SQL database structured in this way.
Database normalization is the theory behind relational databases wherein information is separated into different tables to prevent redundancy. Meaning if you sell something to customer #1000, the sales line table will record the amount, quantity, customer number, and other unique information related to the sale. The table with transactional information is called a Fact Table. The customer attributes such as the assigned salesperson, credit terms and address are stored in a dimensional table. These tables are related to each other through keys. Thus, customer #1000 in the sales line table is the same customer #1000 in the customer table. This primary and foreign key relationship associates the tables and by linking these keys to different dimensions and can be analyzed. For example, all the customer sales from a certain zip code would be obtained by summing the sales fact table based on that dimension linked by the common field, customer number.
Traditional database reporting works on these concepts. To answer a question, one would query a database with a set of filters to return the results. The problem arises when queries grow too big in size and complexity such that the results take too long to return an answer. This problem can become exacerbated when a report has thousands of queries. It is important to understand how different reporting tools work to determine which is best for you.
Data Manipulation
As opposed to normalization, de-normalization is the process of using a data warehouse (DWH) to transform a normalized database into one that is de-normalized. A de-normalized database has redundant data included for optimized read performance. An example of how to use this in Microsoft Dynamics 365 Business Central and Dynamics NAV is the Sales Header and Sales Line tables. Some of the data in the header table is not needed in the line table as it would be redundant (e.g., repeated salesperson info on each transactional line). In a data warehouse, you can combine these tables by adding fields to the line table from the header table such as salesperson. This redundant information makes reporting easier by allowing you to report and filter on this field without linking the tables.
The data warehouse is a separate database that resides independently on a server and can contain information from multiple data sources. Through an Extract Transform and Load (ETL) process, the data warehouse tables are created from these sources. This means combining CRM, POS, time-keeping, or other database systems into the same central source for easy reporting. Data warehouses can be built using add-on products like Power BI, BI360, Jet Reports, or through the tools available in SQL.
SQL Server Analysis Services (SSAS)
With friendly names, single table data sources created from previously disjoined tables, and the flexibility to manipulate data, a data warehouse can be a big improvement in self-service reporting. This, however, is not the only function of a data warehouse. The data warehouse is the data source for SQL Server Analysis Services (SSAS). SSAS is the Microsoft business intelligence technology that produces an Online Analytical Processing (OLAP) solution. The result is a multi-dimensional model (cubes) that is used for reporting and analyzing trends.
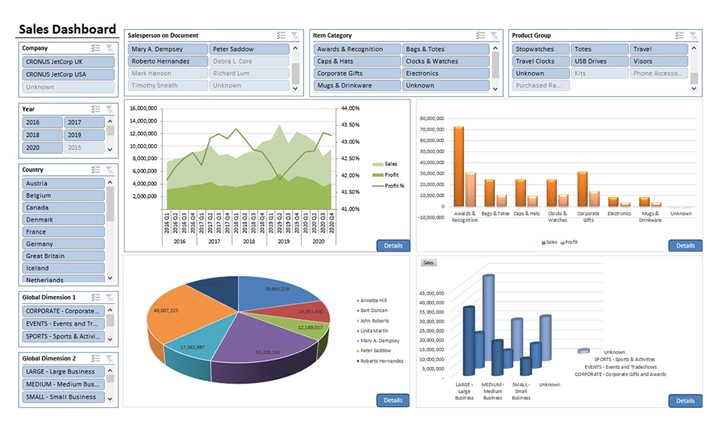
A cube is different from the standard SQL reporting data sources that are used to run a business. Typical reporting focuses on the past; last month’s sales, the GL balance of account 12000, on hand counts, etc. A cube can be used for these same metrics, but its real power lies in looking forward. Cubes are great for asking questions: Where are sales growing? How did the release of a product influence other business segments?
Should we budget differently? These tools are often referred to as Dashboards. Dashboards typically connect to a cube and there are many visualization programs that display this data differently. The power of a cube is in its performance and ease of use. The questions we posed earlier could be answered going into BC or NAV, exporting the data to Excel, putting the data into a pivot table and connecting slicers.
This sort of data dump data analysis is very popular and used by companies without advanced reporting solutions to meet short-term analysis needs. One could also write a Jet Report; run a SQL query or many other solutions to review the data. These self-service reporting options are available for many savvy IT users who have access to the table data and know how to make the right connections.
In a cube, all the metrics are predefined and building a dashboard or pivot table on a developed cube is as easy as dragging and dropping the fields. This easy-to-use solution allows someone at any level of an organization or technical ability to find the answers they need. The cube solution also solves many of the speed problems that arise from multiple complex queries and becomes even more pivotal with the ubiquitous nature of mobile: data must travel farther than ever from the source. Accessibility to dashboards in a variety of settings and on different devices adds to the difficulty of publishing these dashboards to users where and when they use information. No longer are reports limited to being issued by your business analyst at a desk. Mobile reporting allows your Sales Manager to answer inquiries directly during a meeting, with accurate data-driven responses, or for a question in a Board Meeting to be answered quickly and accurately, even if that information is not already included in the published slide deck.
BI Tools for Business Central and NAV: Jet Analytics, Power BI, BI360, and Database Automation
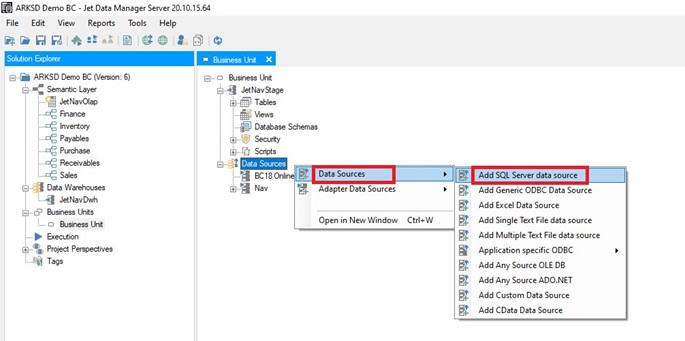
Data warehouse and business intelligence solutions have made significant developments in the recent past. New offerings are available that allow for relatively quick implementation, and administration by users within an organization without major training or programming expertise. Jet Analytics is a data warehouse automation tool. This enterprise solution provides users with an easy-to-use interface, which allows for quick customizations to the data warehouse and cubes. The Jet Data Manager (JDM) tracks all the objects and dependencies from the tables to deliver an end-to-end visual representation of the tables and sources used. What could take days in SSIS will take hours using the Jet Data Manager. Jet Enterprise comes with predefined cubes for sales, finance, inventory, purchasing, AP, and AR meaning that getting started with business intelligence does not take months, but hours. Other solutions like Power BI and BI360 expand on the data warehouse capabilities and publication to web based, handheld, and mobile applications.
Customizations to the cubes are done with drag and drop functionality simplifying many of the complex SQL functions we associate with a business intelligence development.
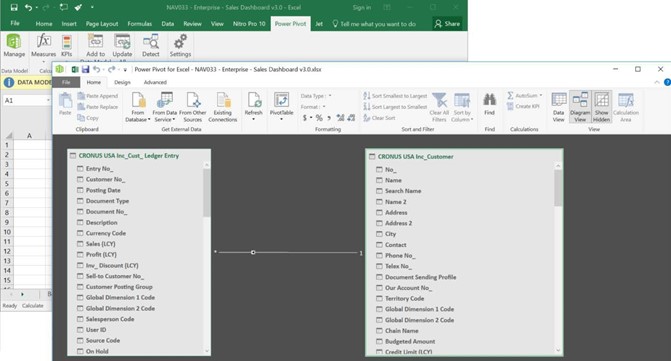
Power Pivot
Power Pivot is an add-in that has been part of Excel since 2010. Power Pivot can connect to a database or analysis service and create its own tabular data model using DAX. DAX is a programming language similar to MDX in functionality, but structured similar to an Excel formula. This familiar format makes programming in DAX possible for most Excel power users.
DAX example: “=SUMX(RelatedTable(FactSales), FactSales[SalesAmount])”
Power Pivot can connect to a large variety of data sources to build a data warehouse and cube. This data model can either then be hosted and shared, or contained within an Excel workbook. One unique advantage of having this model contained within the workbook is it can perform analysis without a connection to the data.
Additionally, the size of a workbook with a large PowerPivot model is much smaller than a traditional Excel workbook with the same information.
More BI Tools for Business Central and NAV: Flat Databases and Standard Reports
Excel
Excel can connect directly to external data sources such as SQL databases. With Excel, one can create pivot tables with data dumps or perform other queries. Also, with a combination of VLOOKUP and SUMIF Excel functions, a creative person can meet many of their reporting needs this way. This manual style of reporting is great for one off projects, but inefficient when performed repeatedly.
Jet Reports
Jet Reports is a SQL querying tool accessible through an Excel add-on. This tool allows users to interact easily with their NAV database for self-service reports. Jet Reports accomplishes this through its own specialized functions that perform complex SQL queries, but presents a friendly, understandable user interface.
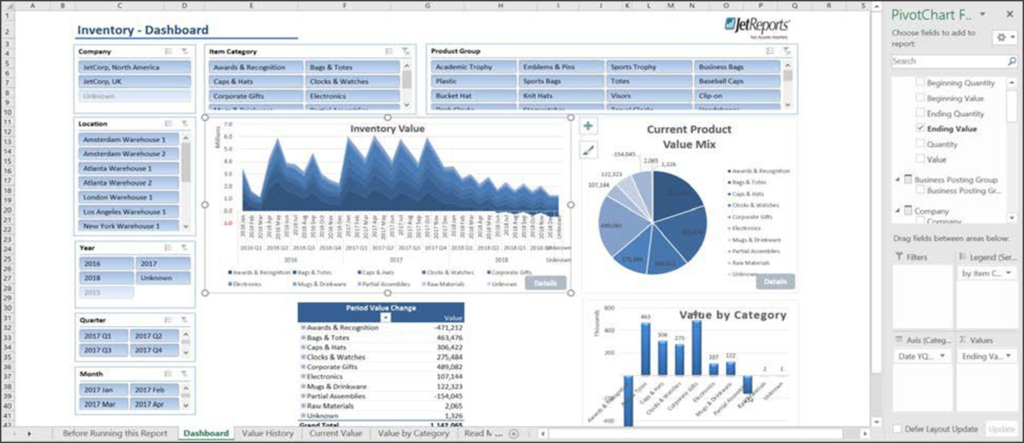
There are three Jet Report products for Excel: Jet Basics, Jet Reports, and Jet Analytics. Jet Basics functionality allows for real time, multi-company financial reports. Jet Reports adds the functionality of replication and other features such as multi-database reporting, automated scheduled reports, and Jet Mobile and Web Portal. Jet Analytics adds dashboards, Data Warehouse, and instant KPI through pre-defined data cubes. Each of these levels includes preformatted report templates, with higher product levels featuring more robust report templates. Most businesses see an immediate ROI from the use of automated reports through saved labor hours and accurate results.
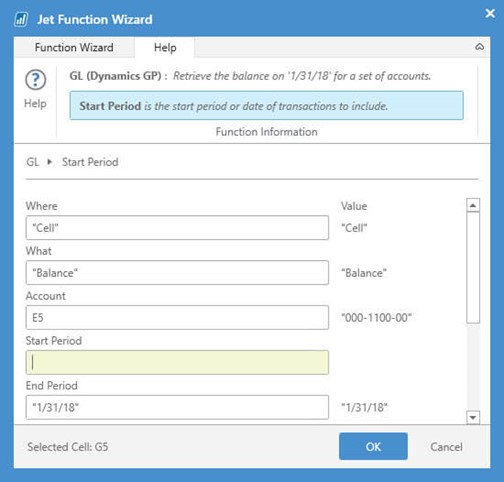
Jet Analytics was originally designed to bring report functionality to BC, NAV and GP. Because of this, Jet Reports has additional functionality for BC, NAV, and GP that makes reporting easier, such as the GL function and friendly field names.
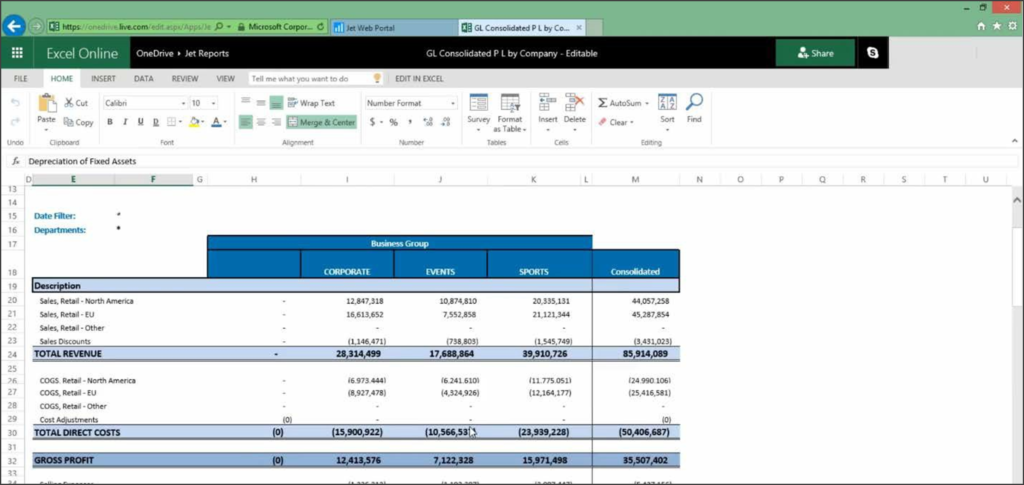
These features make Jet the standard when it comes to BC and NAV self-service reporting. Jet Analytics excels at standard managerial automated reporting like a combined company income statement. Over the years, Jet has developed from simply a NAV reporting tool to servicing over 10,000 customers in many different market segments. Jet’s unique market share has come from increased functionality, enterprise solution, and product flexibility. Jet Reports can connect to most ODBC data sources making it an ideal solution for almost any source. One of Jet Reports favorite sayings is, “Any report, Anyway, Right now.”
The Jet Mobile and Web Portal is a content management system that allows users to share, collaborate, and publish reports at any time, regardless of the location. Additional features include search, version control, and report permissions. Compatible with Office 365, the web portal not only allows for viewing the data as well as refreshing the data and getting up-to-date information remotely.
Power BI
Power BI is a cloud-based business analytics service. Power BI users can connect to a wide variety of data sources including SQL, Dynamics 365, Salesforce, Azure, and many more. Power BI is reviewed in more detail in the next section. Power BI is included here because it is outstanding at reporting against almost any data source, including SQL BC, NAV, or DWH tables. Data categorized correctly can be used for many reports with matrix and table functions. However, financials and other standard reports are typically generated using Jet Reports, the accounting schedule, or a NAV customized report.
Cube Reporting
Excel
Excel is still the standard when it comes to self-service reporting. With a developed cube, users can connect and immediately begin building dashboards with drag and drop functionality. Slicers and other types of filters allow for the analysis of data to begin finding trends. More importantly, any custom reports that have been developed inside your organization can be recreated for seamless integration into your existing business practices.
Power BI
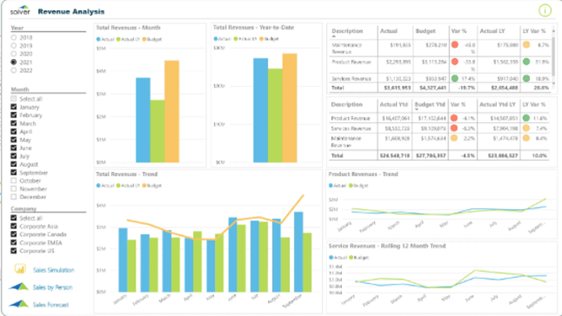
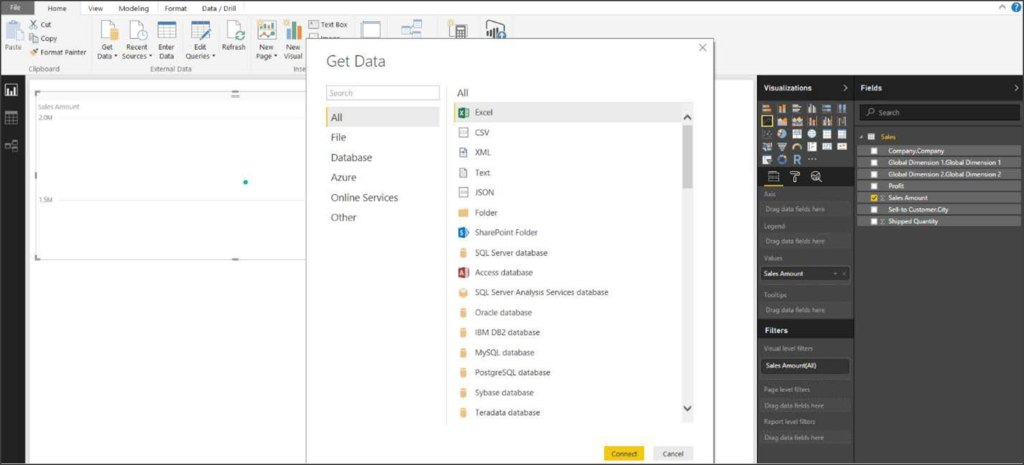
Power BI is a set of analytical tools that businesses use to analyze data. Power BI can connect directly to on- premises or cloud BC or NAV data source (SQL tables, data warehouse or cubes). Once connected one can use the Power BI Desktop application to interact with the data and build dashboards.
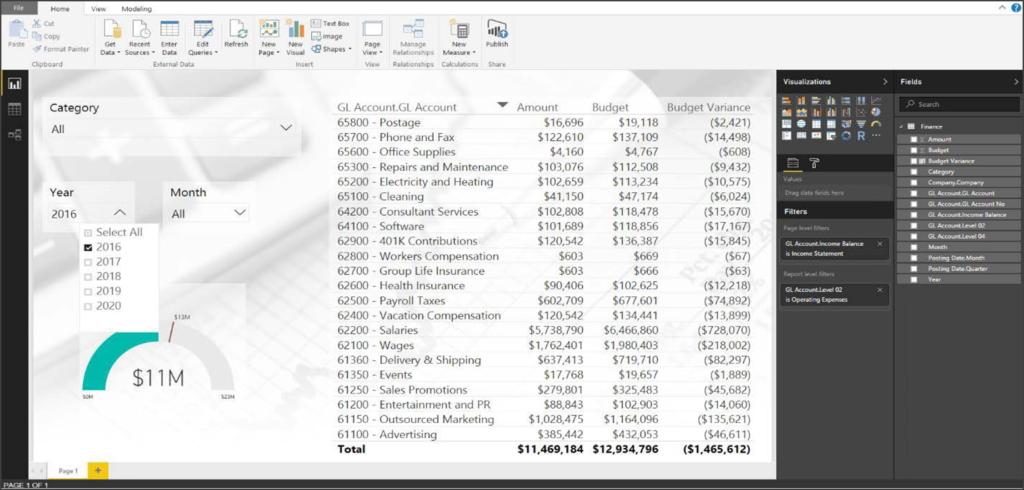
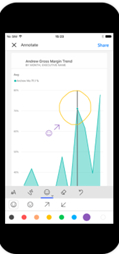
With Power BI one can view live dashboards with real-time updates from anywhere through web hosting or the Power BI Mobile application. Power BI also allows for features like Q&A that allows users to type a question such as, “What was yesterday’s revenue?” or Power BI Groups that enable collaboration. Power BI adds new features and connections continuously including new visuals and prebuilt dashboards.
Power BI and Jet Enterprise make a powerful combination. All data warehouse changes and cube enhancements that are done with Jet Enterprise using the Jet Data Manager are reflected when in all Power BI report updates. This combination allows for easy cube management, fast implementation, and robust functionality.
Other Data Visualization Tools
Many other data visualization tools exist. Some include Tableau, Qlik, and DataZen. These tools can connect to developed cubes in the same way that Excel or Power BI does. Each of these products offer different ways of analyzing the data and should be included in any vetting process.
Cost, Benefits, and ROI of BI Tools for Business Central or NAV
Excel has been the standard for accountants and managers for decades. With its familiar spreadsheet interface, most advanced users can produce company metrics without any extra software. Additionally, with Power Pivot and other Excel free add-ins, most metrics can be obtained using Excel alone. The low software price and broad functionality will keep Excel in the market indefinitely. However, Excel by itself, is an entry-level product for database reporting.
Jet Reports has three different versions: Basics, Reports and Analytics. Jet Basics and Reports are database querying Excel add-ins.
Traditional reporting with Jet Reports (Reports and Basics) bring the power to the user for report customizations and is a leader in the BC and NAV market. Using prebuilt templates, many reporting needs can be immediately met with small customizations. Other reports built from scratch can take longer, but immediate ROIs are gained from the use of automated reporting, taking both the human time and error parts away.
Jet Analytics is a solution for medium to large businesses, businesses that are poised for growth. Analysis with large, complex queries on big data sets are not performant. Data warehouse and cube analysis help meet these demands by organizing the data and presenting a fast-easy- to-use interface. Both Jet Professional and Power BI can use this backend.
SQL Server Analysis Services (SSAS) host OLAP cubes and Jet Enterprise provides easy management of the cube and underlying data warehouse. Excel can connect to the cubes, data warehouse or SQL tables directly providing standard statistical reports and dashboard analysis reporting.
Power BI can connect to the Jet Enterprise cubes or data warehouse, enabling end users the ability to create powerful reports without knowing the technical details behind the scenes. Power BI can also create and host its own cubes by connecting to other sources. Other products that compete with Power BI include Tableau, Qlik, BI360 and many others. Each of the solutions has a cost and implementation time associated with it. Finding which one meets your businesses needs are key.
Understand All the BI Tools for Business Central and NAV
There are many excellent BI tools for Business Central and NAV available today. Choosing the right BI tool is just a matter of understanding your options and comparing them with your needs. Contact ArcherPoint to discuss your business intelligence solution needs.
Trending Posts
- Login Error: Communication protocol mismatch between client and server
- How to Make Measures Total Correctly in Power BI Tables
- The Microsoft Technology Stack – What Is It & Why Should You Care?
- MRP vs. MPS: Choosing the Right Planning Approach for Your Manufacturing Business
- Guide to How Manufacturers Can Implement Quality Control Systems Using Business Central
Stay Informed
Subscribe to Communications
"*required" indicates required fields