Dynamics NAV Dashboard Reporting: Power BI, Jet Enterprise, or Both?

Well-executed dashboard reports can save businesses time and money, help maintain customer relationships, and offer insight on a marketplace or product. However, Business Intelligence reporting is not a simple endeavor: implementations are often costly and time-consuming. In addition, developers can run into snags when pulling massive amounts of information from multiple data sources. New reporting software packages and data modeling solutions are released daily, but they are certainly not all created equal.
To help explain the different options in dashboard reporting and benefits of each, I sat down with an ArcherPoint teammate and BI expert, Jeff Foss, to discuss data modeling options that can incorporate Dynamics NAV data.
What is the Microsoft Power Bl Tool?
JF: Power BI is a Microsoft tool that links disparate data sources to create dashboards and interactive reports. Power BI works by connecting to data sources such as Dynamics NAV (Navision) or Excel, and then transform and load the data into a data model for reporting. It does this by linking common pieces of information (called foreign and primary keys) to create relationships. For example, if I want to report on ArcherPoint sales, I could bring in all the sales information from our Dynamics NAV such as customers, sales orders, and sales locations and link them to our CRM and marketing systems to create meaningful metrics that drive business.
What are the Limitations of Power BI?
JF: Power BI is a Microsoft solution meant to expand your reporting tools, not replace. Most companies will still rely on their corporate data warehouse solution for high volume processing and complex queries. Power BI’s data model will more commonly be used for one-time reports or reporting on small data sets.
What if a Company Wants to Create Large, Complex Data Models?
JF: With best in class, continuously updated functionality, Power BI makes self-service reporting easy for end users. With the familiar Excel feel to DAX (language that Power BI uses), Power BI empowers non-technical users to create their own metrics. Power BI has limitations on both the number of joins per table link and how large the files can become. Complex, large data models are not something you would look to host using Power BI. For this, you would want an enterprise data warehouse solution hosted on SQL or another platform.
What is the Value of Power BI if You Already Have Jet Enterprise?
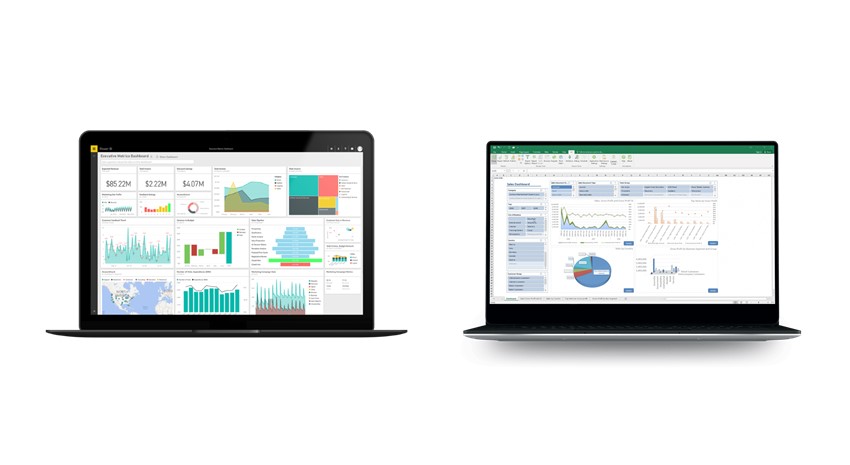
JF: Jet Enterprise can do the visuals through Excel, but Power BI is a much better visualization tool than Excel. Power BI is free and the dashboards are so much cleaner and easier to read. That is exactly what BI is: consuming information, analyzing it, and consuming it in an insightful way. The power is in the backend of Jet Enterprise, but I would recommend using Jet and Power BI together for nice-looking dashboards that can house a whole bunch of data from multiple sources.
What is the Most Complicated Part of Dashboard Reporting?
JF: The most complex part of dashboard reporting is building up the backend. Discovering where your data lives, tying it all together, auditing, it can be very involved. Jet Enterprise is great because the most commonly used fields and amounts are already predefined, meaning that the discovery and development process is greatly reduced.
How Long Does it Take To Get Up and Running with Jet Enterprise?
JF: The average data warehouse implementation takes 17 months, with Jet Enterprise, it takes hours.
For more information on how to design a Jet Reports plan and implement in hours, contact us today.
Trending Posts
Stay Informed
Choose Your Preferences
"*required" indicates required fields
