
The Importance of Productivity Measurements in Managing Your Business

Measuring productivity is important to managing your business. The key, though, is to create a measurement that helps you manage all the variables to maximize the profitability of your company. This blog describes the ideal productivity management tools and how this can be accomplished in Microsoft Dynamics Business Central (BC) or NAV.
Defining the Components of Productivity
First, let’s look at the components that make up productivity:
- Utilization: Utilization measures how well the process ran from a time perspective. If a department works an 8-hour shift, did the process run all 8 hours, or was there down time? If there was a setup required, or the machine broke down for 4 hours, then the utilization was 50%.
- Efficiency: Efficiency measures how well the process ran when it was running. Ideally, the performance measurement is measuring how well the process ran based on the process that was being used. For example, if a machine is expected to produce 100 pieces an hour, did we, in fact, produce 100 pieces an hour? If we only produced 90 pieces an hour, then the efficiency was 90%.
- Method: Method measures the efficiency of the process that was used, compared to the “Standard” process for that item. For example, an item runs best on one machine but can be run using another machine. It might be an older machine that was used prior to buying the current, preferred machine. The old process yields the same part but can only produce 90 pieces per hour rather than 100 pieces per hour. Therefore, the old process is only 90% as productive as the new machine.
Productivity, then, is defined as: Efficiency * Method * Utilization = Productivity
Why Measure All Three Statistics
Breaking productivity down into these multiple components helps you quickly identify the reason productivity is what it is and provides direction on how to move forward to improve your productivity.
Let’s look at some examples to see why this is important.
Utilization
Machine down time is not necessarily a bad thing. It could be extremely “productive” to set up and run the same item all day, every day. The problem is, customer service would suffer because all that would be in inventory is that one item. So, by definition, you would likely have machine down time to change from one item to another.
Similarly, preventative maintenance is a positive thing. History has proven that taking a small amount of time on a regular basis to perform maintenance and replace parts at the end of their life cycle yields a higher level of utilization in the long run, rather than dealing with breakdowns. The preventative approach reduces the down time because the parts are ordered and are on hand, delivered at minimum cost rather than paying emergency prices and delivery costs.
So, to recap, we should measure utilization so that we can understand how much of productivity is caused by machine utilization. Below, we will talk about how to measure utilization in Dynamics NAV or Business Central and spend more time talking about how to understand how much of the utilization performance is due to good versus bad down time.
Efficiency
Many people confuse efficiency and productivity. They both are measuring output in a window of time. Efficiency, however, focuses on the effectiveness of the process and removes the issues of machine down time. The solution to resolving excessive down time is different than the solution to resolving processing issues. Measuring efficiency helps focus the attention on the process itself.
By focusing on just processing performance, you can focus on fixing the root cause of the problem. For example, let’s assume that a machine is supposed to run 100 pieces an hour, but if you run the machine at that speed, the machine jams, reducing the number of pieces produced in that hour. You have found that running the machine at 95 pieces per hour eliminates the jams and therefore yields more pieces per hour than if you continued to run it at 100 pieces per hour.
By isolating the process performance from machine utilization, you can more easily identify that something is wrong with the process and can go about focusing on fixing the true root cause (machine jamming).
Method
Similar to down time, not all productivity variances are a bad thing. Sometimes, it is a good business decision to use an alternate process so you can meet all customer requirements. It is common that a piece of equipment is loaded at more than 100%. If you have an alternate process, it might make good business sense to offload some of that production to another machine so you can meet all of your customer’s demand.
Measuring the method variance allows you to track how much of your productivity performance is due to the fact that an alternate process was used and negatively affected overall productivity. By tracking method efficiency, it makes it clear when the poor productivity is a result of alternate processes and will help you decide if purchasing another piece of equipment would be a solution to increasing your productivity performance.
To summarize, it is important to not only understand your productivity, but to also to understand the components that make up that productivity number. If you just focus on macro productivity, you won’t necessarily be pointed in the right direction when trying to improve your productivity performance.
Using Dynamics NAV or Business Central to Calculate Performance
Dynamics NAV / Business Central does not have a “Productivity Report” in the standard report pack. This is due in part because everyone calculates “productivity” differently. This section will define how you can set Dynamics NAV or Business Central up to capture data that can be used to calculate your productivity performance information.
Utilization
Utilization performance is defined as the number of hours in production versus the available hours. So, if a machine runs for 4 hours in an 8-hour shift, then the utilization is 50%. The trick, then, is to define how many hours a machine is running, or conversely, how many hours a machine did not run on a shift.
BC/NAV allows you to record “Down Time” by using the Capacity Journal. The Capacity Journal allows you to create a Capacity Journal Entry to record the fact that a machine was down, how long it was down, and the reason for the downtime.
Figure 1 shows an example of a Capacity Journal record that would be posted to record an hour of downtime for setup.
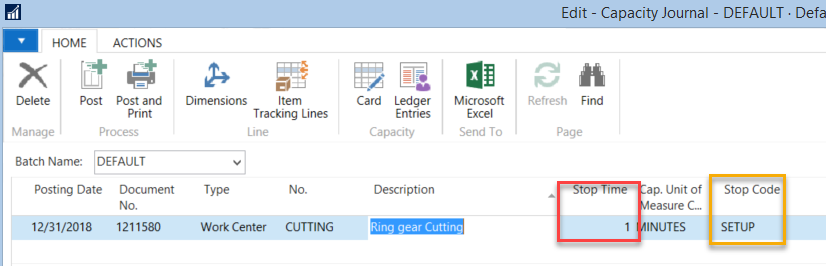
Figure 1 – Capacity Journal record posted to record an hour of downtime for setup in Microsoft Dynamics Business Central or NAV
Note that in the entry in Figure 1, Stop Time defines the length of time that the machine was down and Stop Code defines the reason for the downtime. Stop Code is a table in BC/NAV that allows you to define the expected reasons for a machine to be down. An example of this is shown in Figure 2.
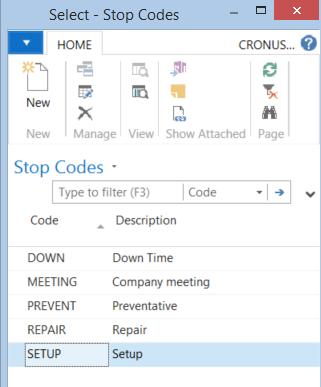
Figure 2 – Stop Code table, where you define expected reasons for machine down time
To calculate the utilization for a Work Center/Machine Center, a report would be required that would:
- Set filter on the Shop Calendar for that Work Center and for the desired date range
- Calculate the Available hours for that work center in the desired date range
- Set filter on the Capacity Ledger Entry table using that Work Center/Machine Center and date range
- Calculate the total Down Time for that Work Center/Machine Center in the desired date range
- Calculate the Utilization = (Available Hours – Down Time)/Available Hours *100
If we assume the machine was down for 3 hours, then the Utilization would be 62.5% or (8-3)/8*100.
Note: An additional report could be created to total down time by reason code to assist in identifying areas to reduce down time and improve productivity.
Efficiency
The Efficiency compares how long it took to run the parts to how long it “should” have taken to run the number of parts that were produced.
Note: The calculation has to be done based on hours because multiple items might be run through a work center in a day. The calculation must use time as the basis of the calculation to be statistically correct.
Because the efficiency must be based on time, the report needs to calculate the length of time it “should” have taken to produce the items. This time is called Earned Hours. The report would then calculate the Efficiency by dividing the difference between the Earned and Actual Hours by the total Earned Hours. (Earned Hours – (Actual Hours – Earned Hours))/Earned Hours
A report would gather this information by:
- Calculating the Earned Hours:
- Set Filter on the Capacity Ledger entries for the Work Center/Machine Center and date range desired
- Total the Earned hours by:
- For each entry found
- Use the routing code (and version if used)/operation number to find the routing run time for the operation
- Earned hours = quantity * run time
- For each entry found
- Total the Actual hours required to produce the output
- Using the same filters above, total the “run time” for that Work Center/Machine Center and date range
- Calculate Efficiency = (Earned Hours – (Difference of Earned and Actual Hours))/ Earned Hours *100
- Let’s assume that in our production orders that:
- Earned hours = 4 hours
- Actual Hours = 5
- Difference between earned and Actual = 1 hour
- Therefore efficiency = (4 -1) / 4 * 100 = 75%
Method
The Method Variance compares the “Expected Run Time” to the “Standard Run Time” for that item. To clarify the terms:
- Expected Run Time: The time it should have taken to produce this item using the process (Routing or Alternate Routing) that was actually used to produce the item.
- Standard Run Time: The time it would have taken to produce item using the standard process (Item Card Routing) for the item
As an example, let’s assume that:
- Actual Run Time (Alternate Routing) used to make the piece has a production rate of 90 pieces per hour, or a run time of .01111 hour
- Standard Run Time (Item Card Routing) used to make the piece has a run time of 100 pieces per hour or a run time of .01 hour
- Difference between the two = .00111
- The Method variance = (Standard Run Time – absolute value of (Standard run time – Expected run time)) / Standard Earned Hours * 100 or (.01 – .00111)/.01 *100 =88.889%
A report would gather this information by:
- Setting a filter on the Routing table using the routing/version code from the production order line
- Calculating the “Actual Run Time” run time by totaling the run time of the operations for that routing
- Setting a filter on the Routing Table using the “Routing Code” from the item card for that item (the “standard” routing)
- Calculating the “Standard Run Time” by totaling the run time of the operations for that routing
- Calculating the method variance using the equation above
Summary
The examples above illustrate how important it is to track all of these pieces of productivity information. The productivity of this machine using the examples above would have been 41%. This sounds terrible and should be cause for alarm!
But if we break the information down into the critical performance areas:
- Utilization = 62.5% (due to the setup time)
- Method Variance = 88.889% (due to using an alternate process)
- Efficiency = 75% (due to the machine jamming when trying to run at the expected rate for that machine)
We now know that a large portion of the performance variance came from setup and method variance. Further investigation is required to make sure those performance issues make sense but aren’t necessarily the worst issue.
We know that the machine did not run as well as expected, but we are now looking into ways to correct the process that was used and not chasing fires thinking that the machine ran at only 41%. The reality is that a large portion of the productivity issue was due to a good business decision to change over the machine and run on an alternate machine to meet customer requirements. We also know that we need to focus on the fact that the machine ran at only 75% efficiency, and that is what needs to be looked at to address the true productivity issue.
If you have questions about productivity measurements for your company, please contact ArcherPoint to schedule a consultation.
Trending Posts
- Login Error: Communication protocol mismatch between client and server
- How to Make Measures Total Correctly in Power BI Tables
- The Microsoft Technology Stack – What Is It & Why Should You Care?
- MRP vs. MPS: Choosing the Right Planning Approach for Your Manufacturing Business
- Guide to How Manufacturers Can Implement Quality Control Systems Using Business Central
Stay Informed
Subscribe to Communications
"*required" indicates required fields