Each month, we bring you the top headlines in the world of Power BI to bring you this Brief to keep you informed, educated, and prepared to take advantage of its constantly changing capabilities. If you have any questions or would like to learn to learn what Power BI can do for your organization, contact… Continue reading Power BI in Brief – November 2019
Category: Power BI
Power BI in Brief – October 2019
Each month, we gather top headlines in the Power BI world to bring you this Brief to keep you informed, educated, and prepared to take advantage of its ever-expanding capabilities. If you have any questions or want to see what Power BI can do for your organization, contact the Power BI experts at ArcherPoint. Power… Continue reading Power BI in Brief – October 2019
How to Dynamically Filter in Jet Reports Using a Drop Down-List

This blog provides step-by step instructions on how to create a dropdown list for end users to use to filter a Jet Report without the end user needing Jet Reports license. As a report designer, when working with Jet Global’s Jet Reports, it can be time consuming to create multiple versions of the same report… Continue reading How to Dynamically Filter in Jet Reports Using a Drop Down-List
ArcherPoint Power BI in Brief – August 2019
Each month, we gather top headlines in the Power BI world to bring you this Brief to keep you informed, educated, and prepared to take advantage of its ever-expanding capabilities. If you have any questions or want to see what Power BI can do for your organization, contact the BI experts at ArcherPoint. July Updates… Continue reading ArcherPoint Power BI in Brief – August 2019
Microsoft Power BI: 5 Reasons You Should Use It

With data clearly taking the position as king in today’s business world, it’s important to have a tool that can help you tame it and use it to your advantage. Microsoft is all about helping you create a “data culture” in your organization—in other words, taking advantage of data across the organization to tackle any… Continue reading Microsoft Power BI: 5 Reasons You Should Use It
Navigating and Optimizing Power BI for More Effective Reporting
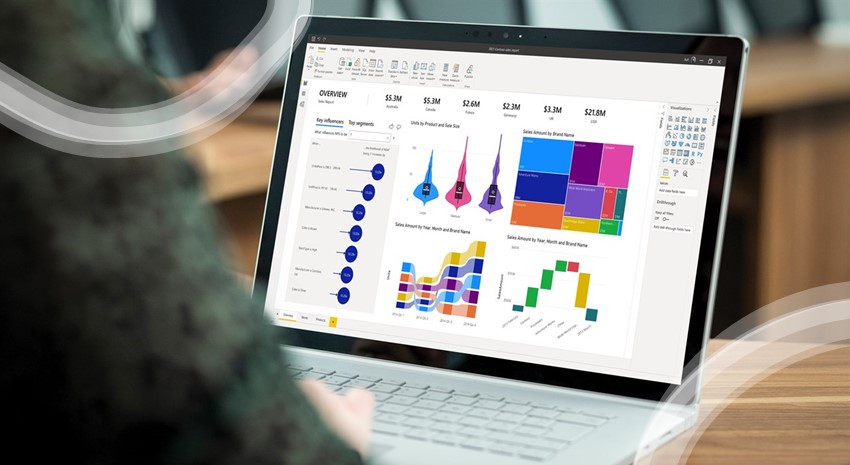
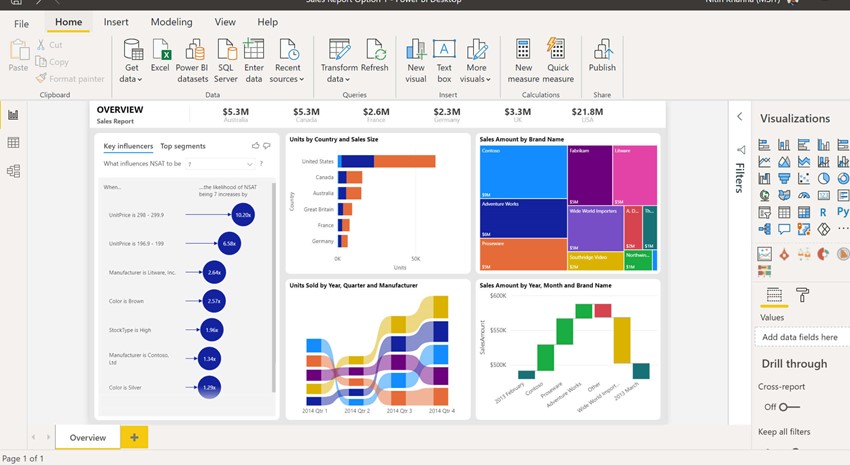
Microsoft Power BI is a reporting and analytics tool that can analyze data from a myriad of sources, including Microsoft Dynamics NAV, Excel, Google Analytics, social networks, APIs, Odata feeds, and more. Power BI allows for creation of interactive KPIs, charts, graphs, matrices, and other visuals to product unique and meaningful reports you can use… Continue reading Navigating and Optimizing Power BI for More Effective Reporting
Microsoft Dynamics NAV Reporting Options: Jet Reports vs Power BI
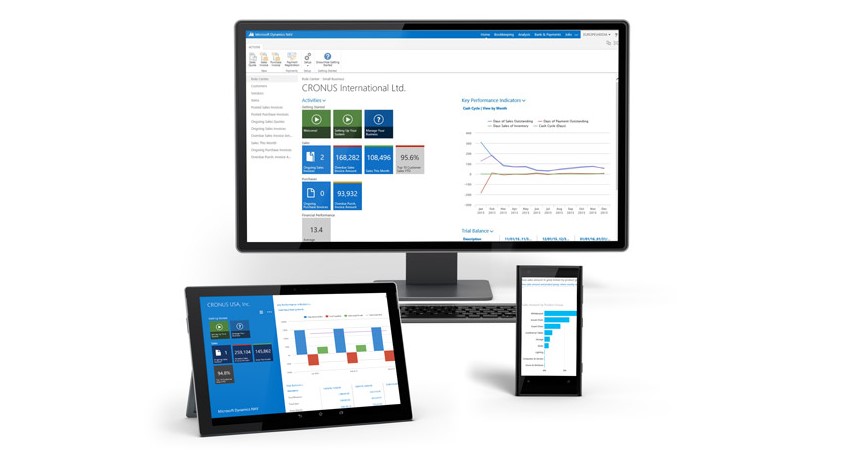
Businesses and organizations of every size are capable of collecting a mountain of information on a regular basis. Putting this information to work for improving process and practice is another issue. Without the right tools, accurate data analysis is difficult at best. And lack of insight at this level ensures poor decision making and missed… Continue reading Microsoft Dynamics NAV Reporting Options: Jet Reports vs Power BI
How to Set Custom Color Themes in Microsoft Power BI
When publishing internal and external reports for your business it is important to be consistent with your branding standards by using the same color schemes and logos. Microsoft Power BI it a great tool for creating and publishing dynamic and interactive reports and it allows for the customization of colors to match your brand standards.… Continue reading How to Set Custom Color Themes in Microsoft Power BI
Creating a Date Table in Power BI
Often when using Microsoft Power BI, you will find that you need a calendar or date reference for your data to organize it by months or weeks, or even the day of the week. If your data has some date information in it but not the specifics you need, building a DAX date table in… Continue reading Creating a Date Table in Power BI
What is Microsoft Power BI?
Microsoft Power BI Benefits There has been a lot of buzz about Power BI is and the potential benefits it can have for businesses, and for good reason. Microsoft Power BI’s suite of business analytics tools allows you to connect to hundreds of data sources, simplify data prep, and drive ad hoc analysis. It enables… Continue reading What is Microsoft Power BI?